Loading video…
All breakouts

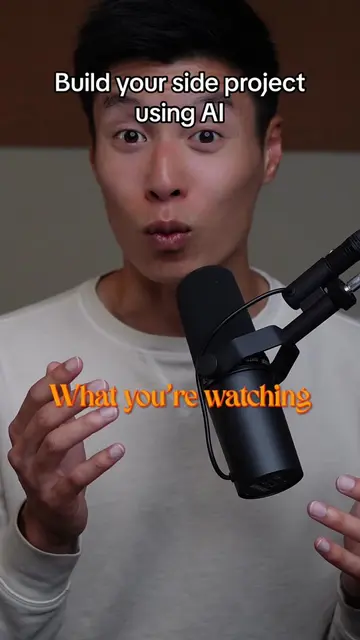
26.9Talking HeadHow-To hook
Hook
Here's a one click way to generate beautiful data visualizations using ChatGPT.
@petehuang
67.1K followers · usually 28.5K views a post
Views
711.5K
Likes
14.8K
Comments
148
Shares
2.7K
Why it worked
The video provides immediate, high-value utility by solving a common pain point (data visualization) with a specific, actionable resource (the prompt) that viewers can immediately use.
Summary
The creator demonstrates how to use a specific prompt from Professor Ethan Mollick to generate professional data visualizations within ChatGPT. He shows the process of uploading a dataset and letting the AI automatically create various charts based on the provided best practices.
Structure
- 1Introduce the problem of creating data visualizations
- 2Share the solution using a specific ChatGPT prompt
- 3Explain the workflow of uploading a file to ChatGPT
- 4Show the AI-generated charts as proof of concept
Product placement
ChatGPT is the central tool being demonstrated for data analysis.
Call to action
Click the link in the comments to access the prompt.
On-screen text
Original caption
Code Interpreter is slowly taking over. All types of analysis being done in seconds. Prompt by Professor Ethan Mollick: https://chat.openai.com/share/afe54a2d-0ad0-4166-b1aa-9a5394deff66 Follow for more #ai #aitools #chatgpt #chatgpthack
More from @petehuang
Their other posts in the index, biggest breakout first.