Hook

Their other posts in the index, biggest breakout first.
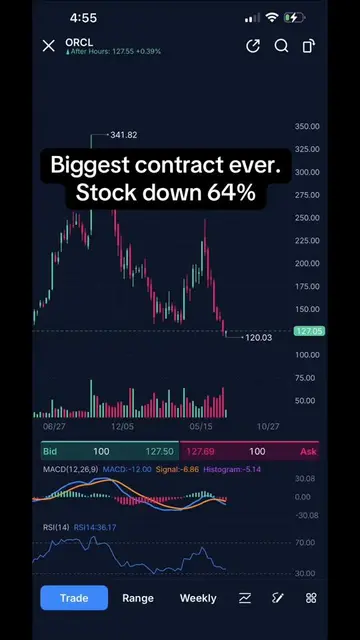
I'm a software engineer and this is how I've made money swing trading using Claude. First, I copy my trading prompt from my website. The link to access this site is in the comments below. I paste it into Claude and add screenshots of the stock. Second later, liquidity. Then an aggregated setup. Entry zone, stop loss, take profits, the full plan. If the technicals don't look good, it lays it out. That's the point. The exact prompt I use to build every swing trade plan is linked in the comments. #aitrading #claudeai #swingtrading #stocks #tradingprompt. Included in your plan limits until Jul 19. You can use up to 50% of your weekly limits on Fable 5, then it runs on usage credits. Fable 5 draws down usage much faster than Opus 4.8. Chat with Claude. Analyze the following chart data for ticker. Use the following detailed framework: 1. Price Structure & Trend Logic (Daily) Identify current trend direction (upt. Analyze the integrity of higher highs. Comment on price positioning relative to highs. Highlight if price historically dips. 2. Momentum Signals (MACD & RSI) Check for bullish/bearish. Analyze RSI positioning. Note if momentum decel. 3. Volume Behavior Look for volume spikes. Is volume confirming buy/sell signals? Note any drying volume. 4. Support/Resistance & Liquidity Key levels: $210-215: VRVP support cluster visible on right panel, prior consolidation zone before the breakout - first meaningfull demand zone $195-200: 50 EMA on daily + high-volume node from the volume profile - strong confluence zone $185: Weekly MA 50 - nuclear here would be a deep dip - $236.54: Recent high / breakout first target on a continuation $250+: Clean air above the breakout psychological and extension NVDA has a well liquidity below key 92% of limit used Resets at 2:30 pm Upgrade 2. Momentum Signals Weekly MACD: Bullish - MACD (10.61) above Signal (7.52), histogram expanding at 3.09. This is a strong momentum read on the weekly with no sign of rollover yet. Daily MACD: Bearish cross in progress - MACD (4.34) has crossed below Signal (5.36), histogram at -1.02. This confirms the short-term pullback is real and not just noise. Momentum is testing on the daily. Weekly RSI: 63.93 - healthy. Not overbought, has room to rise before hitting resistance on the weekly. Daily RSI: 58.79 - mid-zone. Not broken. This is a constructive pullback, but the pullback is a pause, not a reversal. No bearish divergence visible on the daily, but a major top. 5. Pattern Recognition & Stock Behavior The weekly structure looks like a high-tight flag forming after the recent breakout leg - price consolidated sideways for several months (visible in mid-chart), then launched. The current daily pullback from $236.54 has the characteristics of a bull flag - tight, declining volume, holding above key EMAs. NVDA behavioral fingerprint: Historically launches off 50 EMAs on the daily with sharp, fast moves. Known for pre-earnings breakouts and post-earnings consolidation (e.g. "E" visible on daily). Tends to have sharp moves followed by extended consolidation. 92% of limit used Resets at 2:30 pm Upgrade Final Assessment Field Detail Tier Rating A Setup Type Bull Flag / Post-Break Entry Zone $210-218 (VRVP sup Stop Loss $202-204 (below dail Take Profit 1 $236-238 (retest of re Take Profit 2 $255-260 (measured Trailing Stop after TP1? Yes - trail to bre Why not S-tier: Daily MACD bearish cross is active and the pullback hasn't found footing yet. Entry time here - jumping in before the daily chart adds unnecessary risk. Wait for the daily chart to stabilize before committing full size. Behavioral Notes technical structure, giving the chart an additional layer of conviction.