Loading video…
All breakouts

3.8Text-HeavyDirect Question hookGames
Hook
Stock Overclock Undervolt Which would you choose?
@trl601
10.1K followers · usually 3.6K views a post
Views
9.7K
Likes
120
Comments
45
Shares
9
Why it worked
The post leverages a common point of interest and debate within PC gaming communities: the trade-offs between performance, power consumption, and heat when overclocking or undervolting components. By presenting clear, comparative data and posing a direct question, it encourages engagement and discussion in the comments.
Summary
The post compares the performance metrics of a PC system under three different GPU configurations: stock, overclocked (OC), and undervolted (UV). It presents data on power consumption, temperature, VRAM usage, fan speed, and FPS for each setting, asking the viewer which they would choose.
Structure
- 1Introduction of the comparison: Stock, Overclock, Undervolt
- 2Presentation of 'Stock' settings and performance metrics
- 3Presentation of 'UV' (Undervolt) settings and performance metrics
- 4Presentation of 'OC' (Overclock) settings and performance metrics
- 5Question to the viewer: Which would you choose?
Product placement
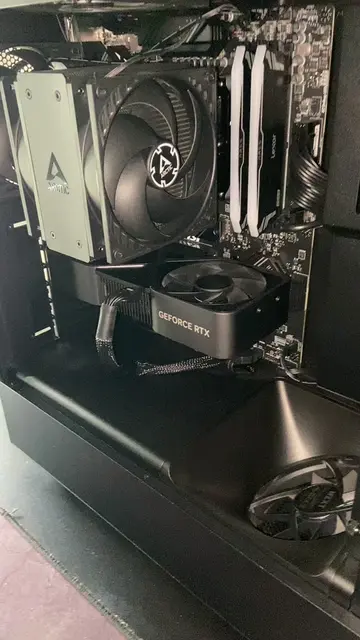
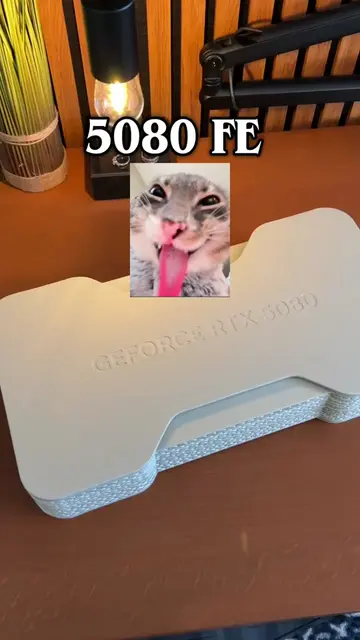
NVIDIA GeForce RTX 5080 Founders Edition (RTX 5080FE): This is a graphics card that is being tested and benchmarked. Removing it would change the entire video. It ACTS. AMD Ryzen 7800X3D (7800X3D): This is a CPU that is part of the benchmarked system. Removing it would change the entire video. It ACTS. D3D12: This is a graphics API used for benchmarking. Removing it would change the entire video. It ACTS.
On-screen text
Stock
Overclock
Undervolt
Which would you
choose?
Stock
RTX 5080FE 98 %
Power 288.3 W
Temp 52 °C
Vram 6980 MB
Fan 1100 RPM
7800X3D 11 %
Temp 50 °C
Power 44.8 W
RAM 11378 MB
D3D12 116 FPS
OC and UV settings ↓
UV
RTX 5080FE 98 %
Power 240.7 W
Temp 50 °C
Vram 6857 MB
Fan 1100 RPM
7800X3D 12 %
Temp 48 °C
Power 45.4 W
RAM 10915 MB
D3D12 120 FPS
OC
RTX 5080FE 98 %
Power 313.6 W
Temp 61 °C
Vram 6863 MB
Fan 1278 RPM
7800X3D 13 %
Temp 50 °C
Power 45.1 W
RAM 11592 MB
D3D12 123 FPS
Original caption
UV is 0.875V at 2720mhz with +2000mhz on the Memory. OC is +400 on the Core and +2000mhz on the Memory with 108% Power Limit. #tl601 #techtok #overclock #undervolt #foundersedition
More from @trl601
More breakout videos from this creator.