Loading video…
All breakouts
4.7Text-HeavyResult / Flex hookFinance
Hook
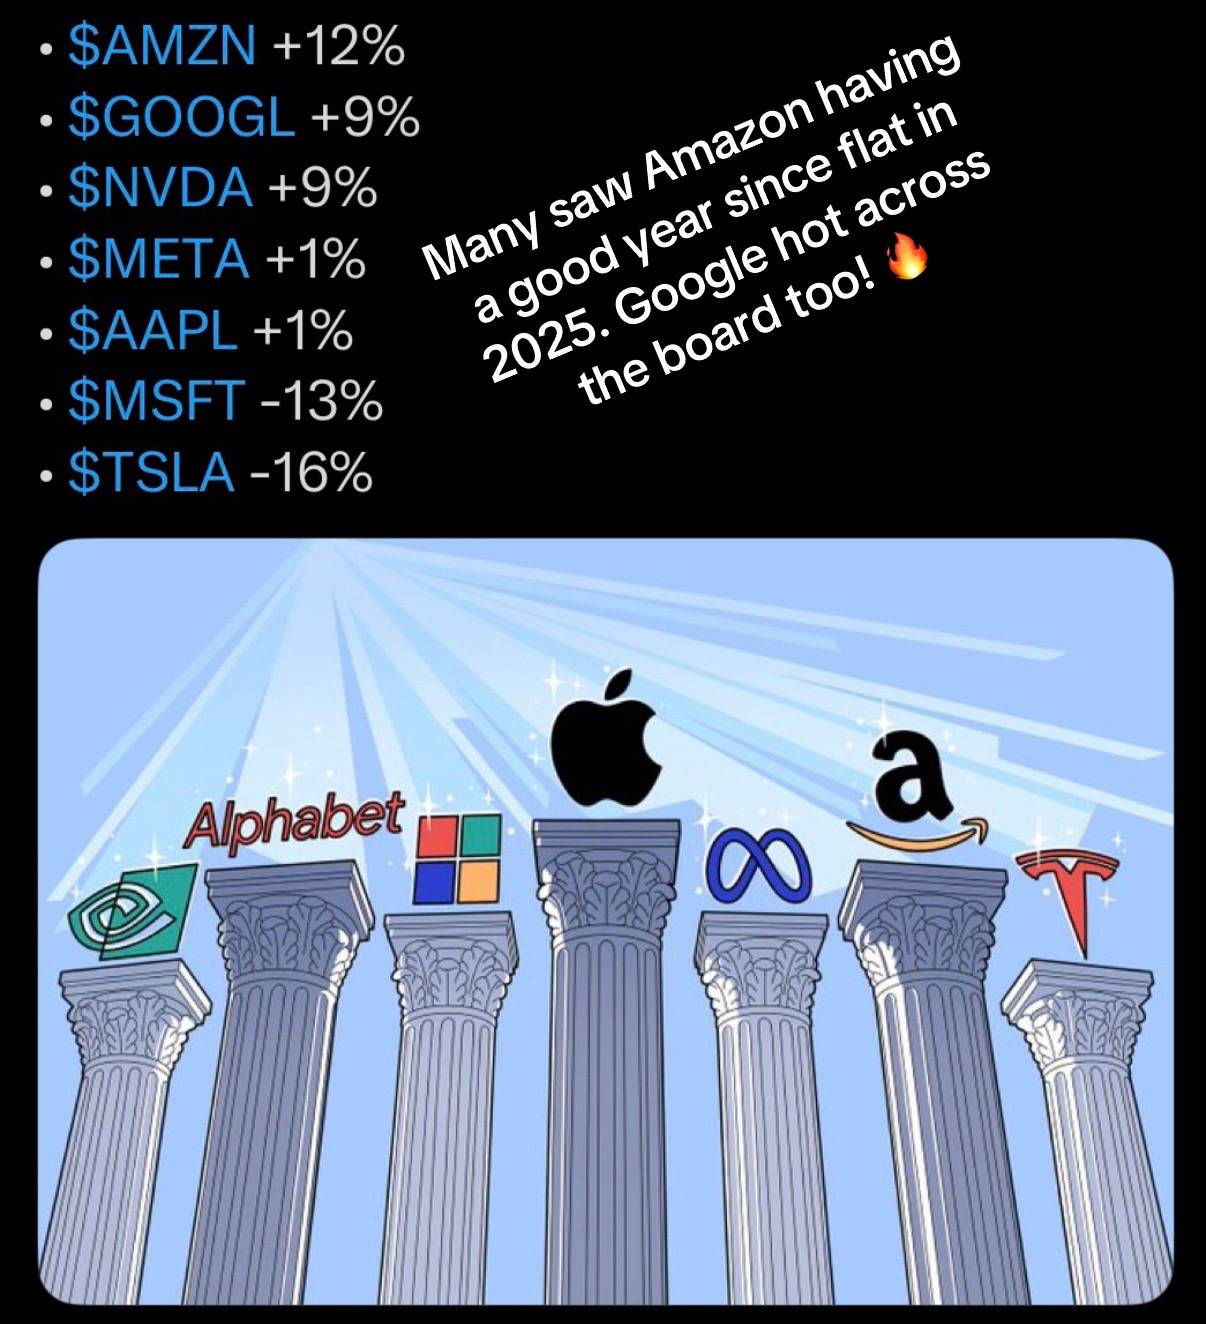
$AMZN +12%
@marketdraft
32.9K followers · usually 714 views a post
Views
3.5K
Likes
21
Comments
0
Shares
0
Why it worked
The post uses a visually engaging format with prominent logos and stock data to capture attention. The text provides a concise and intriguing commentary on market performance, prompting viewers to consider the implications.
Summary
The first slide displays stock performance data for several major tech companies, showing mixed results with Amazon and Google performing well. The second slide features logos of these companies on pillars, with text suggesting Amazon is having a good year and Google is also performing strongly.
Structure
- 1Stock performance data for major tech companies
- 2Logos of tech giants on pillars
- 3Text highlighting Amazon and Google's performance
Product placement
AMZN: APPEARS - stock ticker symbol. Removing it would not change what happens in the video.
GOOGL: APPEARS - stock ticker symbol. Removing it would not change what happens in the video.
NVDA: APPEARS - stock ticker symbol. Removing it would not change what happens in the video.
META: APPEARS - stock ticker symbol. Removing it would not change what happens in the video.
AAPL: APPEARS - stock ticker symbol. Removing it would not change what happens in the video.
MSFT: APPEARS - stock ticker symbol. Removing it would not change what happens in the video.
TSLA: APPEARS - stock ticker symbol. Removing it would not change what happens in the video.
Alphabet: APPEARS - company logo. Removing it would not change what happens in the video.
Nvidia: APPEARS - company logo. Removing it would not change what happens in the video.
Microsoft: APPEARS - company logo. Removing it would not change what happens in the video.
Apple: APPEARS - company logo. Removing it would not change what happens in the video.
Meta: APPEARS - company logo. Removing it would not change what happens in the video.
Amazon: APPEARS - company logo. Removing it would not change what happens in the video.
Tesla: APPEARS - company logo. Removing it would not change what happens in the video.
On-screen text
Original caption
Amazon leads the stock market big companies in 2026 so far this year. Will it last? #stockmarket
More from @marketdraft
More breakout videos from this creator.