Loading video…
All breakouts
73.7Text-HeavyHow-To hookFinance
Hook
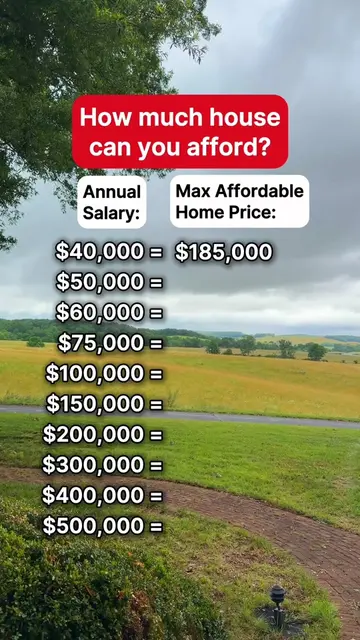
How Much House You Can Afford
@thejoehardy
2.8K followers · usually 1.6K views a post
Views
349.2K
Likes
547
Comments
69
Shares
89
Why it worked
The video provides immediate, high-utility financial data in a clean, easy-to-read format that addresses a common pain point for homeowners and aspiring buyers.
Summary
The video displays a table showing the relationship between annual salary and maximum recommended monthly mortgage payments. It advises viewers to limit housing costs to 30% of their take-home pay to maintain financial health.
Structure
- 1Presenting the title hook
- 2Displaying the salary-to-payment table
- 3Scrolling through the data points
- 4Providing financial advice in the caption
On-screen text
How Much House You Can Afford
Annual Salary
Monthly Payment
40,000
60,000
80,000
100,000
120,000
140,000
160,000
180,000
200,000
220,000
820/mo
1180/mo
1510/mo
1830/mo
2130/mo
2420/mo
2700/mo
2970/mo
3220/mo
3460/mo
Transcript
How Much House You Can Afford. Annual Salary. Monthly Payment. 40,000 820/mo. 60,000 1180/mo. 80,000 1510/mo. 100,000 1830/mo. 120,000 2130/mo. 140,000 2420/mo. 160,000 2700/mo. 180,000 2970/mo. 200,000 3220/mo. 220,000 3460/mo.
Original caption
Is your house keeping you broke? 🏚️ Most people have no idea how much house they can actually afford. Here's the only number you need: take your monthly take-home pay after taxes and multiply it by 30%. That's your maximum safe housing payment. I use 30% because it keeps your mortgage affordable without sacrificing your future. Go higher and your house starts consuming your entire budget. No room to invest. No room to save. No financial freedom. Your home should build your wealth — not drain it. I broke it down for every income from $40K to $220K so you can find YOUR number in seconds. 👇 💡 Always calculate from take-home pay, NOT your gross salary. #HouseAffordability #HomeBuyingTips #FirstTimeHomeBuyer #PersonalFinance #RealEstateTips
More from @thejoehardy
More breakout videos from this creator.