Loading video…
All breakouts
13.4Silent UGCStory Open hookEcommerce
Hook
Les muestro cómo terminó el fin de semana
@alejogarcia7a
1.7K followers · usually 2.0K views a post
Views
25.3K
Likes
564
Comments
56
Shares
49
Why it worked
The video uses high-value social proof by displaying impressive financial metrics, which builds authority and trust for the creator's agency services.
Summary
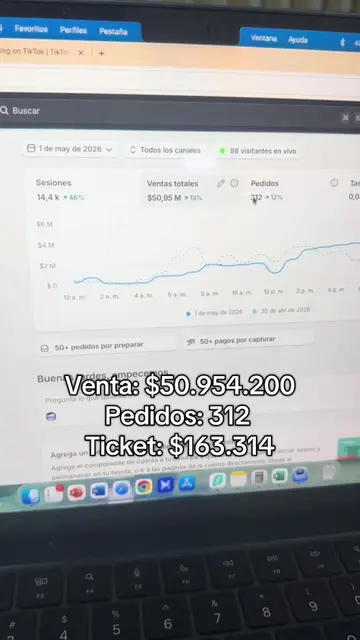
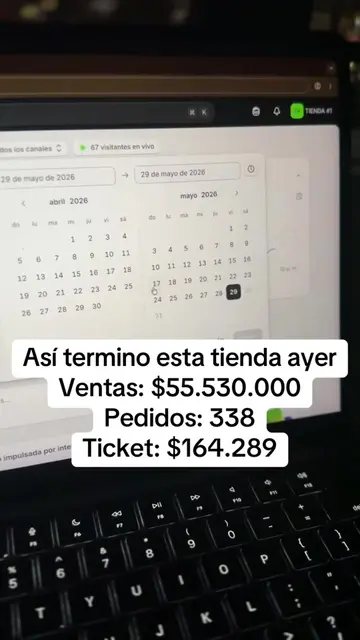
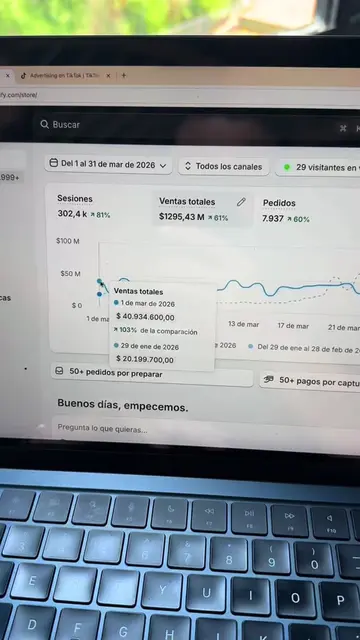
The creator shows a screen recording of a Shopify dashboard displaying sales data for a specific weekend. The video highlights the total sales, average ticket price, and number of orders achieved by a client's store.
Structure
- 1Introduction of the weekend sales data
- 2Displaying the Shopify dashboard metrics
- 3Highlighting the total sales and order volume
- 4Showing real-time data for the current day
Product placement
Shopify is shown as the platform hosting the store, but it is the substrate, not the product being sold.
On-screen text
Así terminó el fin de semana
Ventas totales: $199.415.800
Ticket promedio: $164.180
CPA: $18.723
Pedidos: 1.215
Transcript
Les muestro cómo terminó el fin de semana del sábado 6 al lunes 8 de junio. Vendimos en esta tienda casi los 200 millones de pesos, 1215 pedidos. Espectacular para esta tienda como tal de nuestro cliente y en este momento vamos así. Son las 7:50 y llevamos 249 pedidos el día de hoy.
Original caption
Fin de semana de locos en esta tienda, esto es lo que hace un sistema bien estructurado. 📊 #ecommerce #shopify #emprendimiento #ecommercelatino #negociosonline
More from @alejogarcia7a
More breakout videos from this creator.