Loading video…
All breakouts
24.8Text-HeavyResult / Flex hookFinance
Hook
$1,000 IN 30 DAYS
@thebudgetingprincess
209.0K followers · usually 6.9K views a post
Views
285.4K
Likes
6.4K
Comments
15
Shares
679
Why it worked
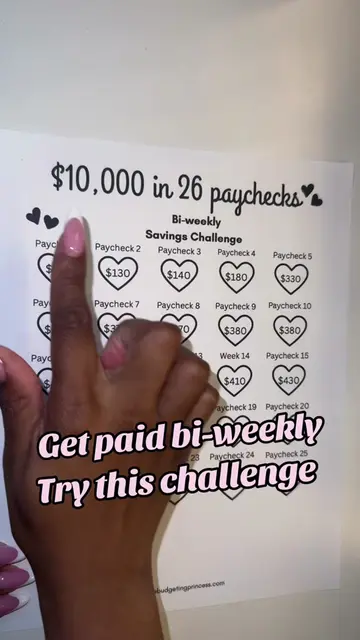
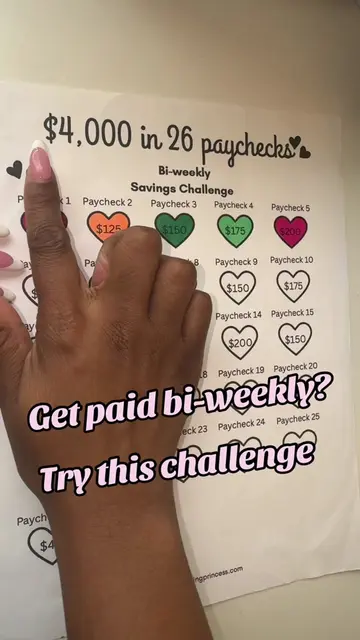
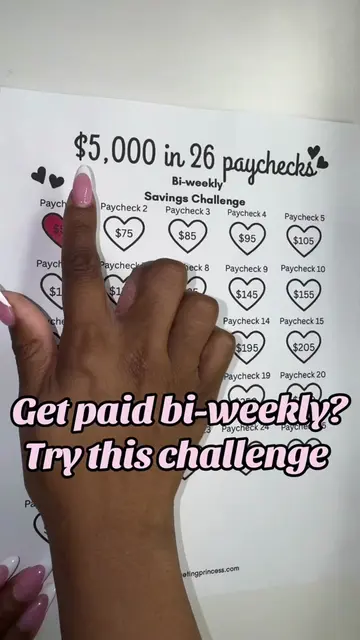
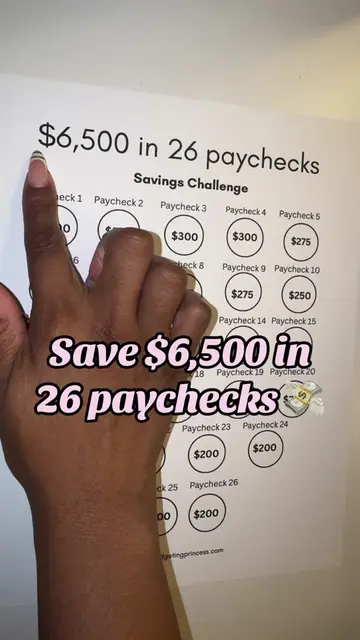
The video uses a visually appealing and easy-to-understand savings challenge graphic that is highly relatable to a broad audience interested in personal finance and money-saving tips. The simple act of marking off a savings amount provides a satisfying visual cue of progress.
Summary
The video shows a savings challenge chart with various dollar amounts in cloud-like shapes. A hand is shown marking off one of the amounts, indicating progress in saving money over 30 days.
Structure
- 1Introduction of the $1,000 in 30 days savings challenge chart
- 2Visual representation of different savings amounts
- 3A hand marking off a savings amount on the chart
- 4Implied progress towards the savings goal
On-screen text
$1,000
IN 30 DAYS
$5
$10
$35
$20
$45
$35
$25
$10
$15
$20
$45
$25
Save $1,000
in30 days
Original caption
Save $1,000 in 30 days with this daily savings challenge💰 #savingchallenge #savingmoney #moneytips #Budgeting #savingchallenge
More from @thebudgetingprincess
More breakout videos from this creator.