On-screen text
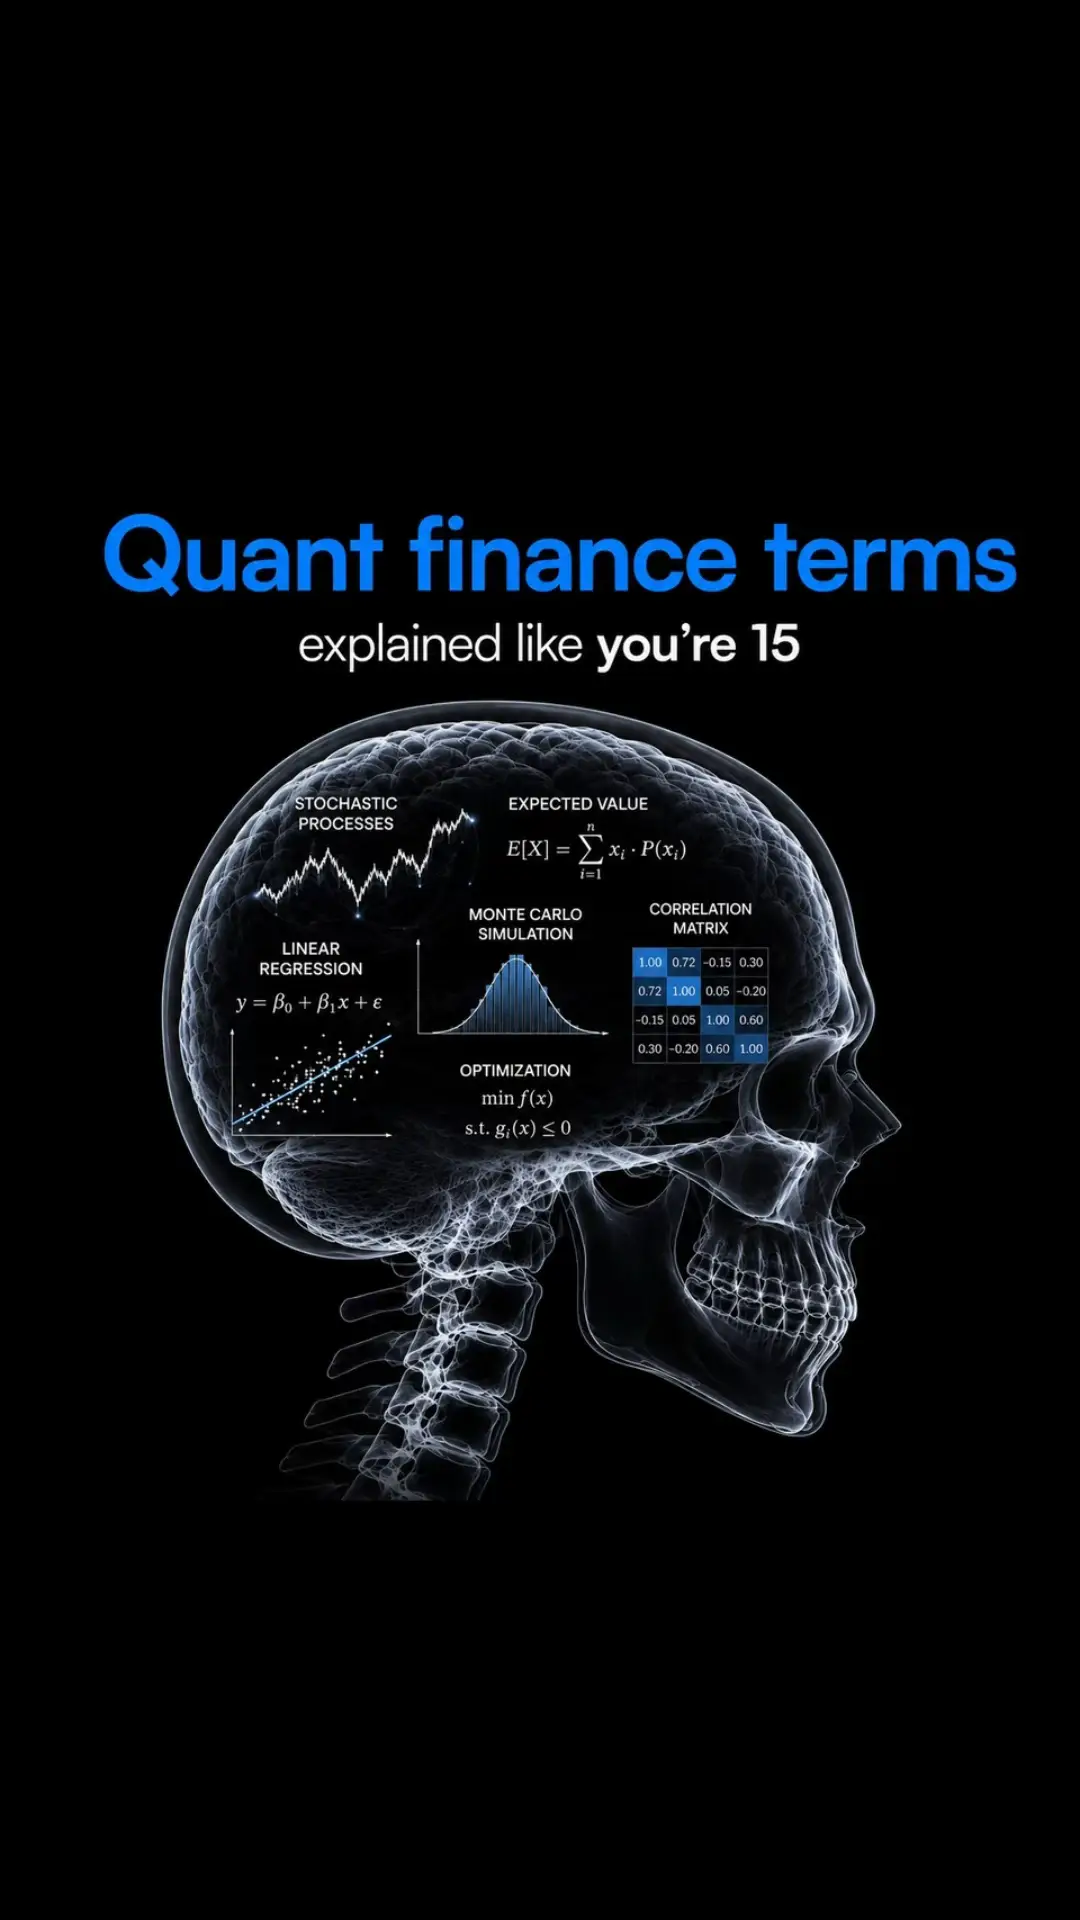
Quant finance terms
explained like you're 15
STOCHASTIC PROCESSES
LINEAR REGRESSION
y = Bo + Bix + E
EXPECTED VALUE
E[X] = sum xi * P(xi)
MONTE CARLO
SIMULATION
CORRELATION
MATRIX
1.00
0.72
0.15
0.30
-0.20
0.05
0.00
-0.20
0.30
0.65
0.05
0.10
0.30
0.35
1.00
-0.30
0.60
1.00
OPTIMIZATION
min f(x)
s.t. g(x) <= 0
1. STOCHASTIC PROCESSES
A random process used to model
how prices move over time.
Example:
Stock prices don't
move in a straight line.
They move randomly,
like a random walk.
Price
Time
Next move is uncertain,
but we can model
the odds.
Think of it as:
Trying to predict the weather,
you can't know exactly,
but you can estimate probabilities.
2. EXPECTED VALUE
The average outcome you expect
over the long run.
Example:
If you win $10 with
60% chance and lose
$5 with 40% chance,
the expected value is
$4.00.
OUTCOME
Win $10
Lose $5
EXPECTED VALUE
PAYOUT (X)
$10
-$5
PROBABILITY (P)
0.60 (60%)
0.40 (40%)
PxP
$6.00
-$2.00
$4.00
FORMULA:
E[X] = sum xi * P(xi)
i=1
xi = possible outcome
P(xi) = probability of that outcome
Think of it as:
If you could repeat the same situation
thousands of times, the average result
would approach the expected value.
3. LINEAR REGRESSION
A way to find the line that best explains
the relationship between variables.
Example:
Predict a stock's return (y)
based on a market factor (x),
such as the S&P 500 return.
Each dot is an observation.
The line shows the best fit.
THE MODEL
y = Bo + Bix + E
y = dependent variable (what we predict)
x = independent variable (what we use
to predict)
Bo = intercept (where the line crosses
the y-axis)
B1 = slope (how much x changes for a
one-unit change in x)
E = error term (the unexplained part)
Stock Return (y)
Best fit line
Error (actual y minus
predicted y)
Market Factor (x)
WHAT IT DOES
Finds the line that minimizes
total squared errors
(the distance between the
dots and the line).
WHY IT MATTERS
Helps us understand relationships,
make predictions, and measure
exposure (e.g., beta in finance).
Think of it as:
Drawing a trend line through a cloud of points
to see the overall direction, even though
individual points may be noisy.
4. MONTE CARLO SIMULATION
Running thousands of possible scenarios
to see a range of potential outcomes.
Example:
You invest $10,000 in the market.
What could it be worth in 1 year?
Instead of guessing one answer,
we simulate thousands of
possible paths.
SIMULATED PRICE PATHS
Portfolio Value ($)
Time (1 Year)
POSSIBLE OUTCOMES
(AFTER 1 YEAR)
5th
Percentile
$6,200
Median
$10,450
95th
Percentile
$15,800
HOW IT WORKS
1 Identify key
inputs and their
possible ranges
(e.g., return,
volatility).
2 Randomly generate
thousands of
scenarios using
those inputs.
3 Calculate the
outcome for
each scenario.
4 Collect all results
and build a
distribution.
5 Analyze the range
of outcomes and
make better
decisions.
WHAT IT DOES
Models uncertainty and
shows a range of possible
outcomes with
probabilities.
WHY IT MATTERS
Helps us understand
risks, prepare for worst
cases, and focus on
what's most likely.
USE CASES
Portfolio risk analysis,
option pricing, forecast
uncertainty, stress
testing, and more.
Think of it as:
Rolling the dice thousands of times
to see all the ways the game could play out,
not just one guess.
5. CORRELATION MATRIX
A table that shows how two assets
move in relation to each other.
Example:
This matrix shows the correlation
between different assets.
Values range from -1 to +1.
1 means they move together,
-1 means they move opposite,
0 means no relationship.
CORRELATION MATRIX EXAMPLE
Stocks
Bonds
Gold
Real Estate Commodities
Stocks
1.00
-0.20
0.10
0.65
0.30
Bonds
-0.20
1.00
-0.15
0.25
0.10
Gold
0.10
-0.15
1.00
0.20
0.40
Real Estate
0.65
0.25
0.20
1.00
0.35
Commodities
0.30
0.10
0.40
0.35
1.00
WHAT IT TELLS YOU
Positive (near +1)
Assets tend to move
in the same direction.
Less diversification
benefit.
Near 0
Assets have little
to no relationship.
Good for building
diversified portfolios.
Negative (near -1)
Assets tend to move
in opposite directions.
Great for risk
management.
WHY IT MATTERS
Helps investors understand
relationships, reduce risk,
and build more efficient,
diversified portfolios.
HOW IT'S USED
Used in portfolio
construction, risk
assessment, hedge
selection, and more.
REAL WORLD EXAMPLE
Stocks and bonds often have
low correlation, which helps
balance risk in a portfolio.
Think of it as:
If your friends always make the same decisions as you,
you're not getting new perspectives. A good mix of
friends thinks differently, which balances things out.
6. OPTIMIZATION
Finding the best possible solution
from many available options.
Example:
You want the highest return
for the lowest risk.
Optimization helps find the
best combination of assets
to achieve that goal.
RISK VS. RETURN: THE EFFICIENT FRONTIER
14
12
Highest return
for this level
of risk
10
Expected Return (%)
8
6
4
2
Lowest risk
for this level
of return
Efficient Frontier
(Best possible
combinations)
Possible
Combinations
(Higher risk for the
same return)
0
5
10
15
20
25
30
Risk (Standard Deviation %)
HOW OPTIMIZATION WORKS
1 Define inputs
(Expected returns,
risks, correlations,
and constraints).
2 Set the objective
(Maximize or
minimize).
3 Run the optimization
algorithm. Tests
millions of possible
combinations.
4 Find the optimal
solution.
The best portfolio
for your goal.
5 Get the asset
allocation.
The weights of
each asset in
your portfolio.
WHY IT MATTERS
Helps you build portfolios
that are more efficient,
diversified, and aligned
with your risk tolerance.
COMMON OBJECTIVES
Maximize return for a given
level of risk, or minimize
risk for a given return.
Maximize the Sharpe ratio.
Meet a target return with minimal risk.
REAL WORLD USES
Portfolio construction,
risk management, asset
allocation, pension funds,
and robo-advisors.
Think of it as:
Packing a suitcase with limited space and weight.
You choose the right items to get the most value
without exceeding the limit.