Loading video…
All breakouts
89.9Text-HeavyOther hookFinance
Hook
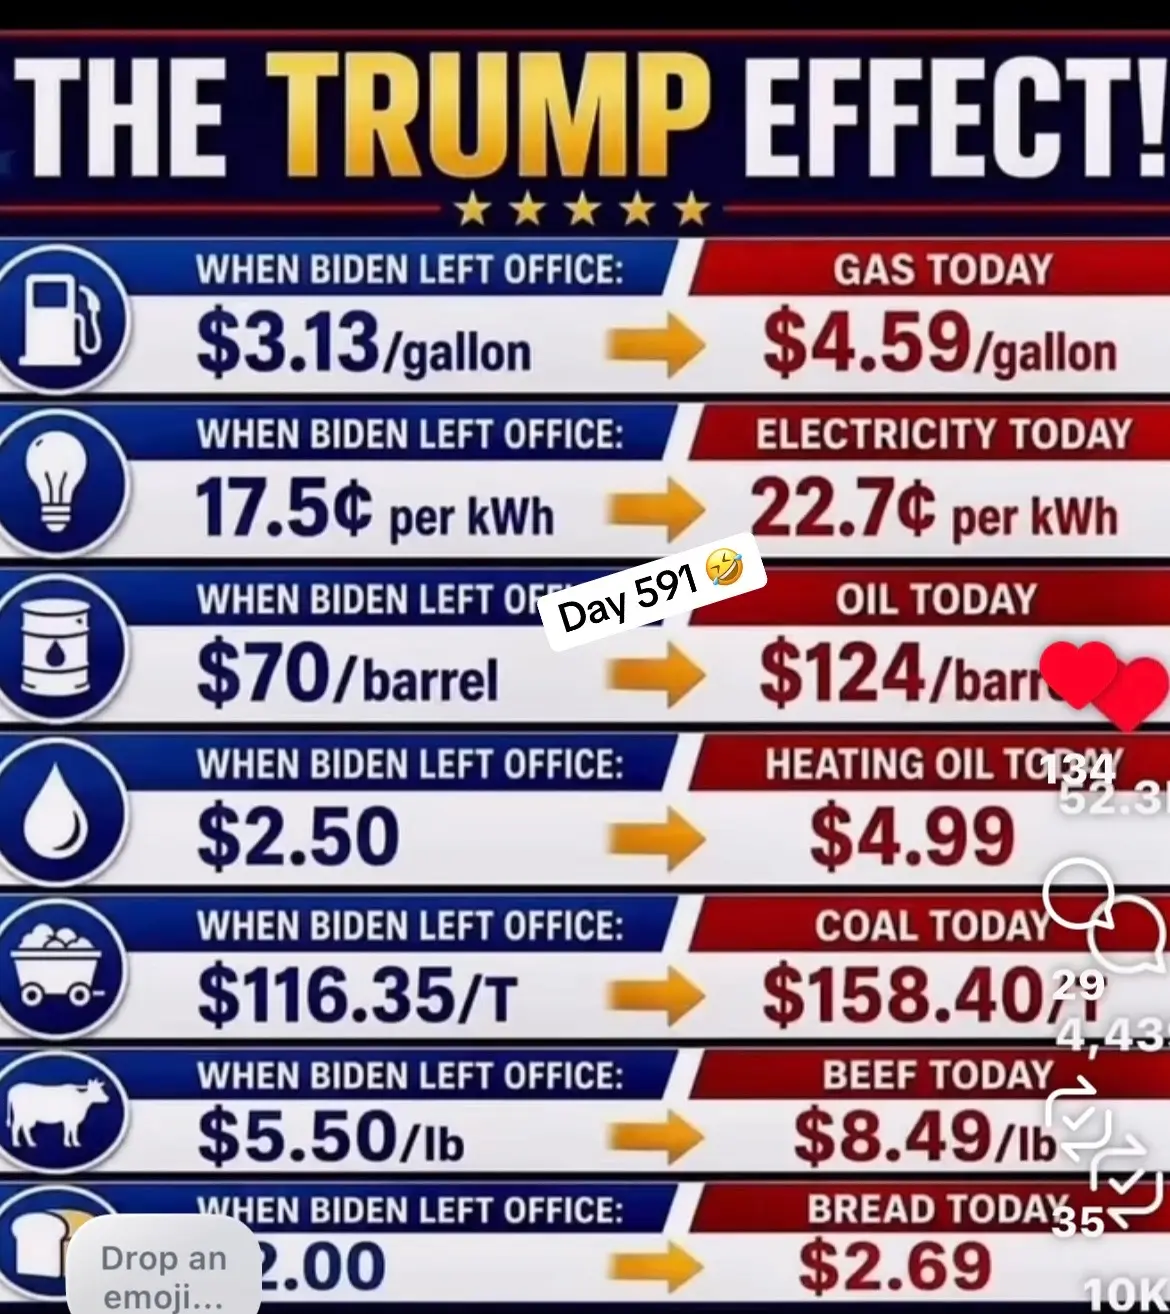
THE TRUMP EFFECT!
@kristinas2.0
110.1K followers · usually 4.9K views a post
Views
424.0K
Likes
6.2K
Comments
1.2K
Shares
2.3K
Why it worked
The post leverages a highly polarizing political figure and presents economic data in a simple, comparative format that is easily digestible and shareable, appealing to a specific political viewpoint.
Summary
This is a slideshow comparing economic indicators such as gas, electricity, oil, coal, beef, and bread prices during the Trump administration versus the Biden administration. The presentation highlights perceived increases in prices under Biden.
Structure
- 1Title slide: The Trump Effect
- 2Gas prices comparison
- 3Electricity prices comparison
- 4Oil prices comparison
- 5Heating oil prices comparison
- 6Coal prices comparison
- 7Beef prices comparison
- 8Bread prices comparison
On-screen text
THE TRUMP EFFECT!
WHEN BIDEN LEFT OFFICE:
$3.13/gallon
WHEN BIDEN LEFT OFFICE:
17.5¢ per kWh
WHEN BIDEN LEFT OF
$70/barrel
WHEN BIDEN LEFT OFFICE:
$2.50
WHEN BIDEN LEFT OFFICE:
$116.35/T
WHEN BIDEN LEFT OFFICE:
$5.50/lb
WHEN BIDEN LEFT OFFICE:
2.00
GAS TODAY
$4.59/gallon
ELECTRICITY TODAY
22.7¢ per kWh
OIL TODAY
$124/barrel
HEATING OIL TODAY
$4.99
COAL TODAY
$158.40
BEEF TODAY
$8.49/lb
BREAD TODAY
$2.69
Original caption
Day 1 🤔 it is day 591🤣🤣🤣 #day1 #prices #inflation #presidentdonaldtrump
More from @kristinas2.0
More breakout videos from this creator.