Loading video…
All breakouts
14.0Silent UGCResult / Flex hookFinance
Hook
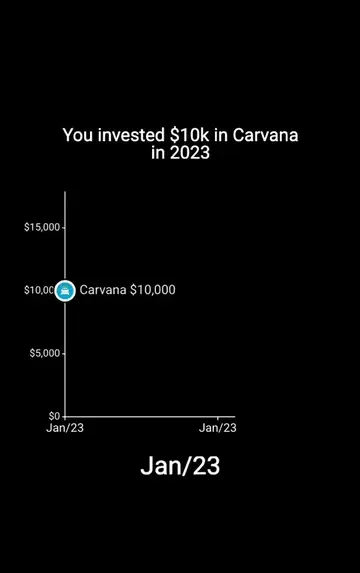
You invested $10k in Micron a little over a year ago
@financetrivia
3.0K followers · usually 295 views a post
Views
4.1K
Likes
44
Comments
7
Shares
4
SoundTikTok sound · E85
Why it worked
The video leverages a compelling visual narrative of exponential financial growth, tapping into the universal desire for successful investments. The clear, simple graph and the dramatic increase in value create a strong sense of aspiration and potential.
Summary
The video visualizes the hypothetical growth of a $10,000 investment in Micron stock over approximately 13 months, showing a significant increase in value. The on-screen text and graph illustrate the stock's performance from May/25 to June/26.
Structure
- 1Initial investment of $10k in Micron
- 2Stock value fluctuates over several months
- 3Significant upward trend begins around Sep/25
- 4Investment value dramatically increases by June/26
Product placement
Micron (stock) - a company that manufactures semiconductor memory and computer data storage products. It ACTS as an investment vehicle, showing its stock performance over time. Removing it would change the video's entire premise.
On-screen text
You invested $10k in Micron
a little over a year ago
May/25
May/25
Jun/25
Jun/25
Jul/25
Jul/25
Aug/25
Aug/25
Sep/25
Sep/25
Oct/25
Oct/25
Nov/25
Nov/25
Dec/25
Dec/25
Jan/26
Jan/26
Feb/26
Feb/26
Mar/26
Mar/26
April/26
April/26
May/26
May/26
June/26
June/26
Original caption
Here's what happened if you invested $10,000 in Micron stock just about a year ago. Hypothetical returns for illustrative purposes only. #finance #stocks #micron #stockmarket
More from @financetrivia
More breakout videos from this creator.