Loading video…
All breakouts
4.3Talking HeadDirect Question hookFinance
Hook
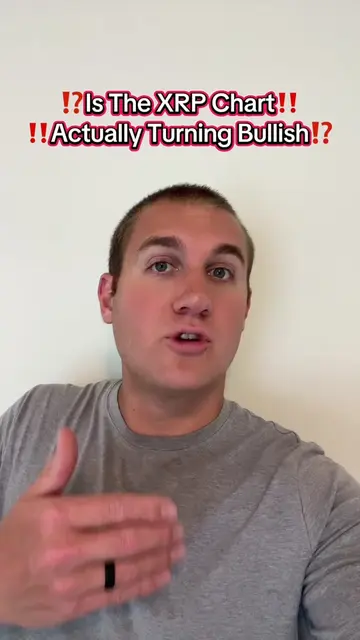
! ? Is The Market Almost !! !! Ready To Snap !?
@justthatcryptoguy
9.4K followers · usually 1.8K views a post
Views
7.7K
Likes
241
Comments
54
Shares
22
Why it worked
The video taps into current market anxieties by presenting a clear technical indicator (the 30-year yield chart) and linking it to potential negative outcomes, while also incorporating geopolitical context and upcoming economic data to create a sense of urgency and relevance for investors.
Summary
The video discusses the potential for the bond market to "snap" or crash, using a 30-year yield chart as evidence. The speaker highlights historical patterns where a 5% yield peak has preceded market downturns, and notes current geopolitical tensions and low market cushion space as contributing factors. They advise viewers to monitor the bond market and upcoming inflation data (CPI and PPI) closely.
Free accountLocked — create a free account to open
Transcript, structure and on-screen text
6 beats, a 424-word transcript and 149 lines of on-screen text — the parts you need to write your own version.
Original caption
7/13/26 - 30Y Bond Yields are about to break through the roof. Is this the final push that breaks the market? Let’s talk about it… #marketupdate #bonds #cryptotok #marketcrash #crash
More from @justthatcryptoguy
More breakout videos from this creator.