Loading video…
All breakouts
10.0Text-HeavyWarning hookEducation
Hook
11M attack in united state and kazakhisatan
@cyberbeta411
7.6K followers · usually 6.2K views a post
Views
34.9K
Likes
1.8K
Comments
30
Shares
53
Why it worked
The video likely gained traction due to its visually engaging display of global cyber threats, using a world map and animated lines to represent attack vectors. The prominent text and statistics create a sense of urgency and relevance, tapping into public interest in cybersecurity and geopolitical events.
Summary
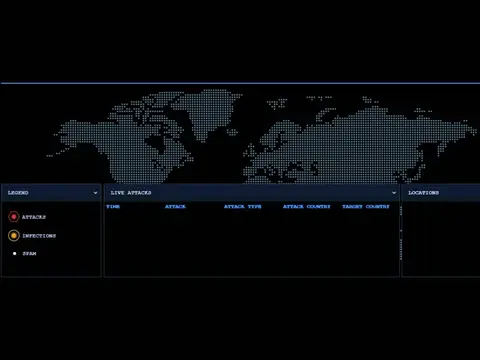
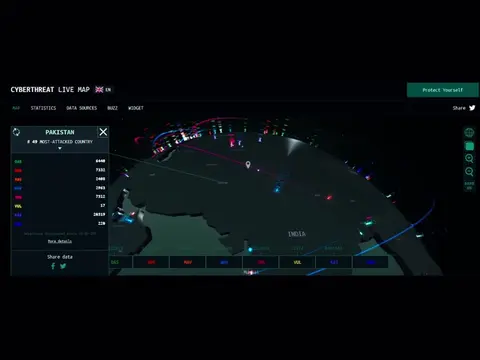
The video displays a world map with animated lines connecting various locations, indicating cyber attacks. Text overlays show the number of attacks on a given day and highlight specific regions like the United States, Mexico, Switzerland, Israel, and Kazakhstan.
Structure
- 1Title card: 11M attack in united state and kazakhisatan
- 2Live Cyber Threat Map displayed
- 3Attack count shown: 11,469,463 attacks on this day
- 4Animated lines show connections between locations on the map
- 5Specific locations highlighted: US, Mexico, Switzerland, Israel, Kazakhstan
On-screen text
11M attack in
united state and kazakhisatan
LIVE CYBER THREAT MAP
11,469,463 ATTACKS ON THIS DAY
US, United States
Mexico
Switzerland
Israel
Kazakhistan
Original caption
Aleart🚨united state and kazakhistan cyber attack in 11M 😯 Cyber war in de world #ethicalhacking #cybersecurity #networking #cyberbeta #hackers #unitedstates #kazakhistan #worldwar3 #editor #cyberattack
More from @cyberbeta411
More breakout videos from this creator.