Loading video…
Sound

original sound - Khoa Bùi
Khoa Bùi · Original audio
0:00–:––
Playing this video’s own audio, so you’ll hear the creator over the sound.
The video provides high-value, actionable technical knowledge in a concise, visually structured format that appeals to developers and data analysts looking for efficiency.
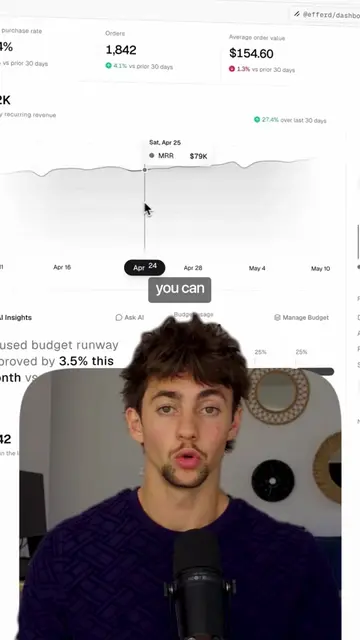
The video provides a quick tutorial on creating a data dashboard using Streamlit and Claude AI. It emphasizes the speed and simplicity of the process compared to traditional tools like Tableau or Power BI.
Tạo Dashboard Dữ Liệu Với Streamlit & Claude AI Trong 5 Phút Học cách tạo dashboard phân tích dữ liệu chuyên nghiệp cực nhanh bằng Streamlit kết hợp với Claude AI mà không cần biết code giao diện. Chỉ với vài bước đơn giản, bạn sẽ sở hữu ngay các biểu đồ tương tác và bộ lọc thông minh trực quan ngay trên trình duyệt. Hãy đăng ký kênh ngay để không bỏ lỡ các bài học lập trình và phân tích dữ liệu thực chiến tiếp theo! #streamlit #dashboard #python #claudeai #phantichdulieu #laptrinhpython #hocpython #datavisualization
Bài học số 168. Dashboard dữ liệu với Streamlit.
Introduction to building a dashboard with Streamlit and Claude AI
Explaining the 3-step prompt process for Claude AI
Highlighting the components available in Streamlit
Demonstrating the command to run the dashboard
Comparing the solution to Tableau and Power BI
Call to action to follow for more lessons
The video promotes the creator's educational content and resources available at khoabui.vn, while using Claude AI and Streamlit as the subject matter for the tutorial.
Đăng ký kênh ngay để không bỏ lỡ các bài học lập trình và phân tích dữ liệu thực chiến tiếp theo!
Playing this video’s own audio, so you’ll hear the creator over the sound.
Outliers and viral hits: their videos on Overshot, all time.
Educational content about data tools and AI for people learning to build dashboards
All time.