Loading video…
All breakouts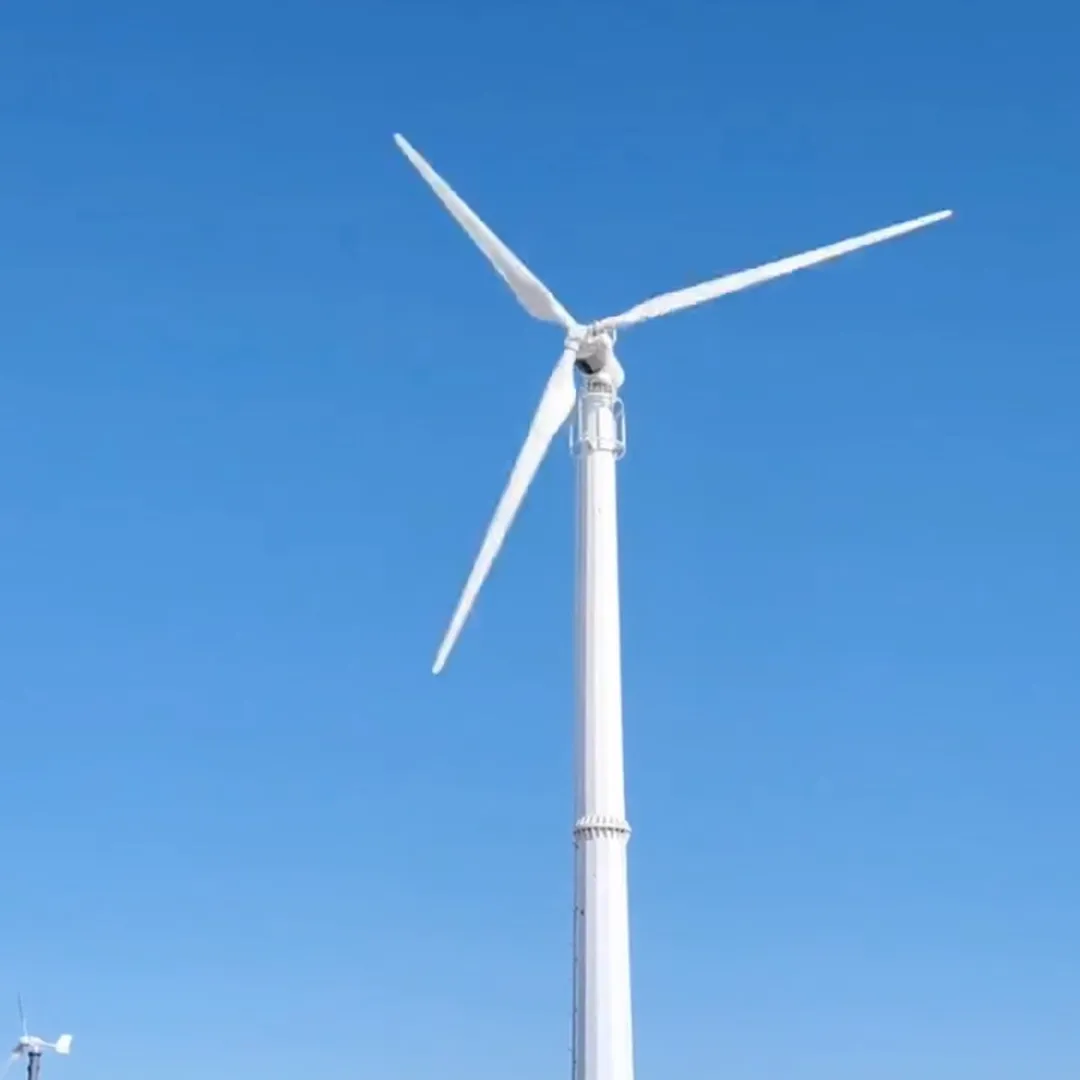
25.7OtherOther hookOther
Hook
正常发电
@windturbine_jianq
35.1K followers · usually 3.6K views a post
Views
89.9K
Likes
2.2K
Comments
45
Shares
130
Why it worked
The video likely worked due to its niche appeal to individuals interested in renewable energy, specifically wind power. The clear, data-rich display of operational metrics for multiple turbines could be informative or satisfying for a specialized audience.
Summary
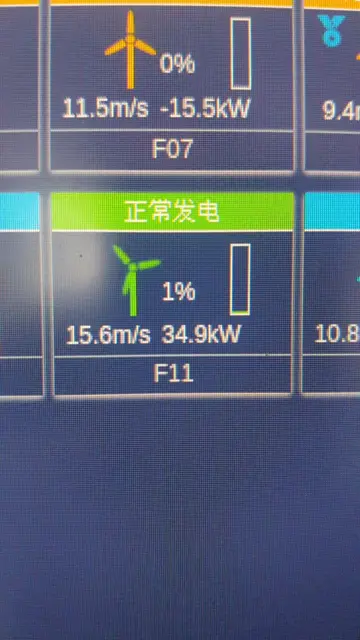
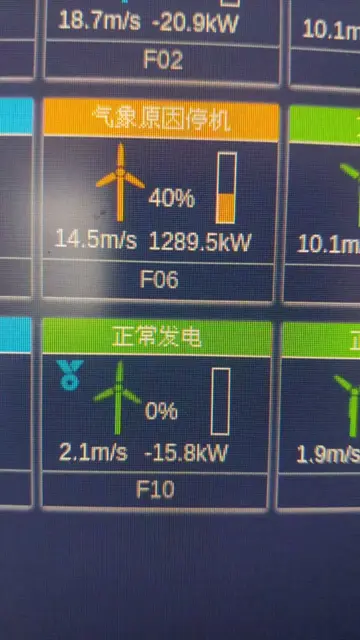
The video displays a dashboard showing the real-time operational status of multiple wind turbines. Each turbine's data includes wind speed, power generation in kW, and a percentage indicator, likely representing efficiency or capacity.
Structure
- 1Display of wind turbine monitoring dashboard
- 2Individual turbine data shown (wind speed, power output)
- 3Percentage indicators for each turbine
- 4Continuous display of operational data
On-screen text
正常发电
101%
11.2m/s 3229.9kW
F01
正常发电
100%
13.3m/s 3201.1kW
F05
正常发电
101%
12.2m/s 3220.6kW
F09
Original caption
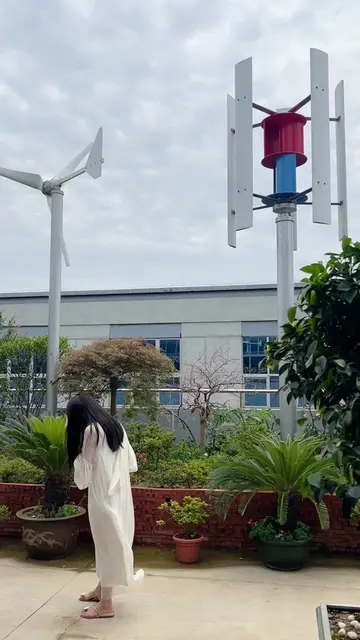
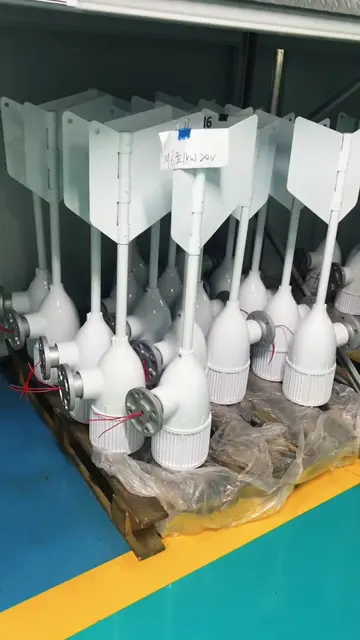
A happy day begins with good news from the wind turbine.#WindPower #windturbine
More from @windturbine_jianq
More breakout videos from this creator.