Loading video…
All videos

Views
186.0K
Likes
2.4K
Comments
134
Shares
209
Engagement
1.5%
of views
13.4xthis account’s usual viewsOutlier · Viral hit (100K+ views)
This video186.0KUsual views15.1K
The product
Nike stock
No product page yet
This video promotes it, but we haven’t matched it to a product page yet, so there are no product figures.
The creator
Why it worked
The post leverages a universally recognized brand (Nike) and a compelling narrative (stock at a 12-year low) to discuss investment strategy. It uses clear data points and a direct question to engage viewers, encouraging them to swipe for more information and potentially save the post for future reference.
What happens
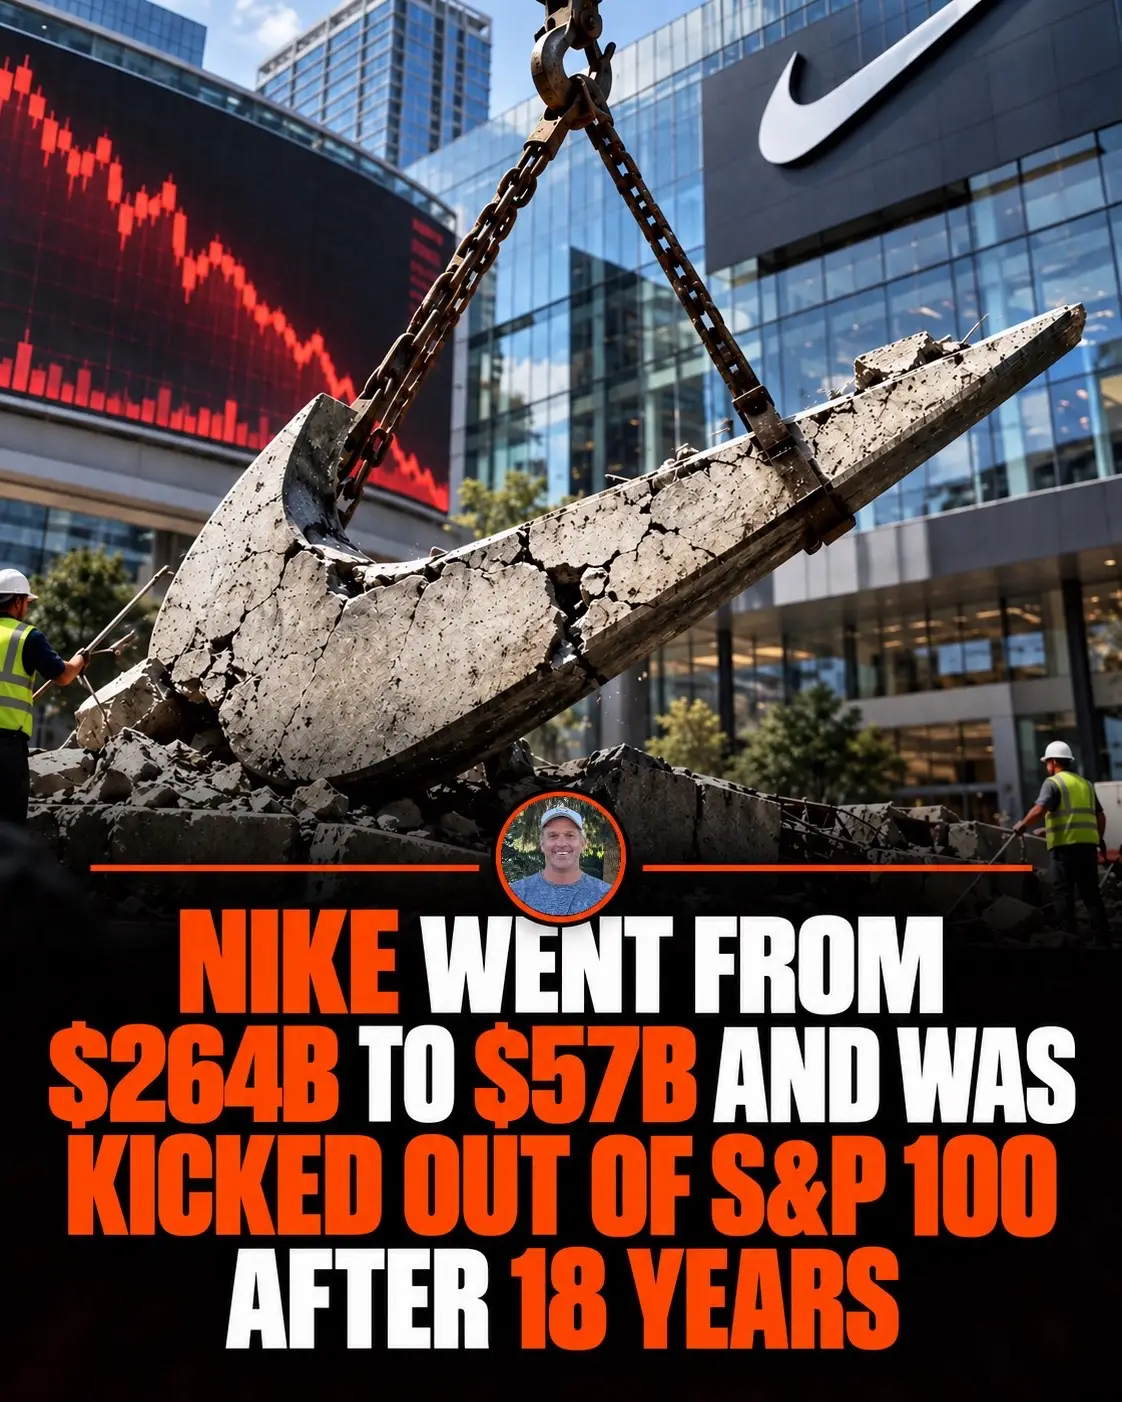
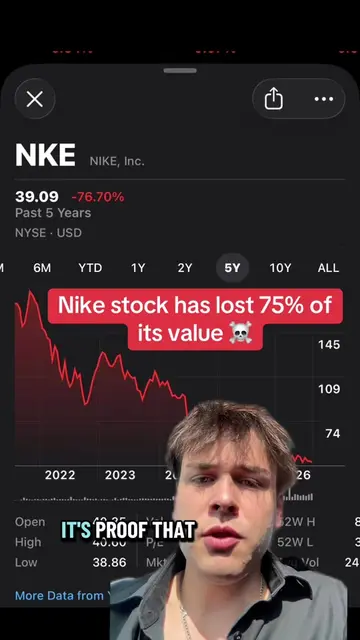
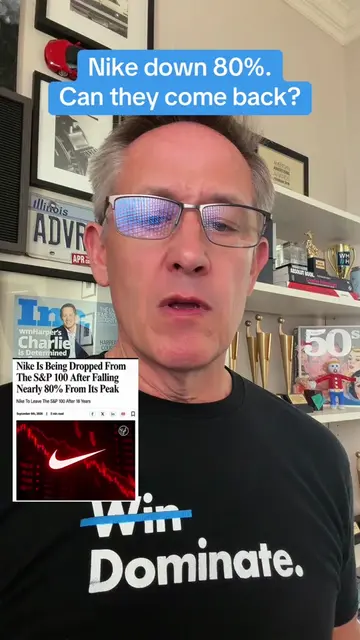
This post analyzes Nike's stock performance, questioning whether its current low price represents a buying opportunity or a value trap. It delves into the company's financial performance, market challenges in China, and potential recovery signs, ultimately presenting a recap of key data points.
The breakdown
Original caption
Nike is at a 12-year low. Here’s the thing that made me post this. The stock trades at 19x what it earned last year, cheap against a five-year average near 32x. But it trades at 24x what it’s expected to earn next year. The multiple goes up as you look forward. That only happens one way: the market thinks earnings are going to shrink. That’s the difference between a cheap stock and a value trap, and it’s the single most useful thing I know about valuation. Costs you nothing to check on any stock you own. Trailing multiple lower than forward multiple = the market is pricing a decline. Two things I left off the slides: The dividend. Nike pays $0.41 a quarter, roughly a 4% yield. So “12 years, zero return” is true on the share price only, a holder did get paid to wait. It doesn’t fix the thesis but it’s the fair version. RSI divergence. On the 5-year chart, RSI has been making higher lows while price made lower lows. Textbook bullish signal. Also the most over-claimed pattern in technical analysis, it fails about as often as it works. If you spotted it on slide 6, you were right to. Everything here is backward-looking. The only forward number that matters is FY27 guidance, and that lands September 24 with a CFO who started six weeks ago. Save this and check it against that call. #stockstobuy #stockstowatch