Loading video…
Sound

IMPACTO (Live)
RICK SOM
0:00–:––
- Videos using it
- 21
- Creators
- 14
- Views on those videos
- 3.9M
We didn’t find a product being promoted in this video. Its hook, format and structure below still show why it took off.
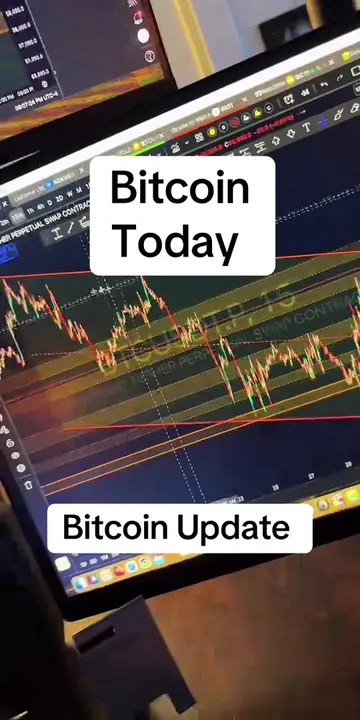
Browse products winning on TikTokThe video effectively uses clear on-screen text and visual aids to explain complex trading concepts, making it easy for viewers to understand and follow the analysis of the BTCUSDT chart. The step-by-step breakdown of trading patterns and potential price movements likely resonated with an audience interested in financial markets.
This video explains trading concepts like trendlines and liquidity using a BTCUSDT chart. It illustrates how to identify support, resistance, and trading ranges, and discusses potential price movements based on these indicators. The video also touches on concepts like liquidity sweeps and bullish candle signals.
follow for more best vedio #xauusd #forexsignals #stocktrading #cryptotrading
TRENDLINE + LIQUIDITY
Introduction of Trendline and Liquidity concepts
Analysis of BTCUSDT chart with time frame and date
Identification of chart patterns: Spike, Channel, Resistance, Support, Trading Range
Discussion of price prediction difficulty in certain scenarios
Explanation of internal sell-side liquidity and swing lows
Illustration of potential price movements (fakeout, drop, sweep, move up)
Explanation of liquidity sweeps and full-body closes
Identification of bullish candle signals
Marking of Take Profit and Stoploss zones
Outliers and viral hits: their videos on Overshot, all time.