Loading video…
All breakouts
89.1OtherOther hookEducation
Hook
India vs China : GDP Race 2025
@economy.wars2
2.9K followers · usually 5.7K views a post
Views
499.1K
Likes
8.6K
Comments
190
Shares
104
Why it worked
The video uses a high-contrast, fast-paced data visualization that taps into nationalistic sentiment and curiosity about global economic power shifts.
Summary
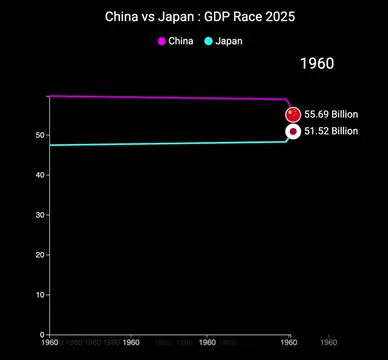
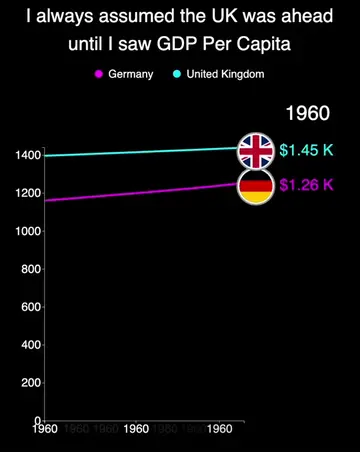
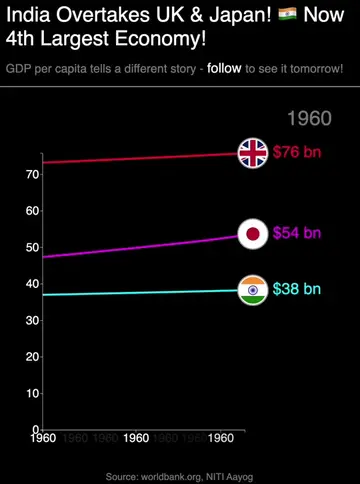
This video presents a time-lapse line graph comparing the GDP growth of India and China from 1960 to 2025. It highlights the significant economic divergence between the two nations over the decades.
Structure
- 1Title screen showing the comparison
- 2Animation of GDP lines diverging
- 3Visual representation of China's rapid growth
- 4Final comparison of 2025 GDP figures
Call to action
Comment your country below!
On-screen text
India vs China : GDP Race 2025
India
China
1960
54.08 Billion
38.31 Billion
Original caption
China 🇨🇳 vs India 🇮🇳 — The GDP WAR is ON! 💸📊 Who’s leading the economic race? 🏁💥 Shocking facts inside! 😱 Comment your country below! 🌍 Follow for more data drops! 🧠⚡️ #ChinaVsIndia #GDPComparison #WorldEconomy #EconomicFacts #IndiaGDP #ChinaGDP #FYP #ForYou #TikTokTrending #TrendingNow #ViralVideo #HotTopic #Reels2025 #MustWatch #FinanceTok #EduTok #DataTok #SmartContent #Infographics #KnowledgeDrop #MindBlown #LearnOnTikTok #CommentYourTake #WhoWillWin #FactsOnly #WatchTillTheEnd #ShareThis #MoneyTalks #China #indiatiktok #Usa #Canada #hongkong #taiwan #Japan #fypシ゚ #fypツ #fyp #trendingvideo #viralvideos #explore
More from @economy.wars2
More breakout videos from this creator.