Loading video…
All breakouts
9.2AnimationOther hookEducation
Hook
GDP Per Capita (USD)
@economy.wars2
2.9K followers · usually 5.7K views a post
Views
51.5K
Likes
636
Comments
91
Shares
11
SoundTikTok sound · GTA
Why it worked
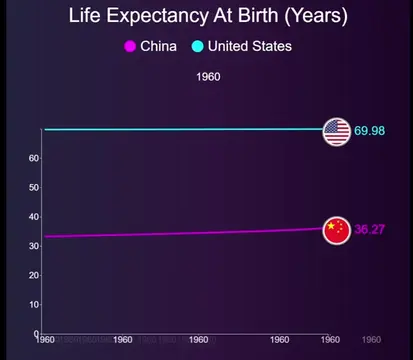
The video uses a clear and visually engaging animation to present a stark economic comparison between the US and China over several decades. The dramatic widening of the gap in GDP per capita is inherently attention-grabbing and likely resonated with viewers interested in global economics and geopolitical trends, leading to high engagement.
Summary
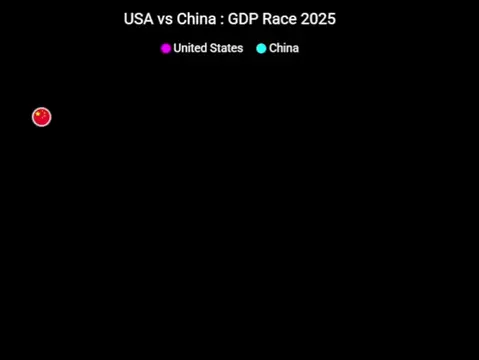
This video displays a graph comparing the GDP per capita (USD) of the United States and China from 1960 to 2024. The graph shows a significant and widening gap between the two countries, with the US consistently having a much higher GDP per capita.
Structure
- 1Introduction of GDP per capita comparison between US and China
- 2Visual representation of data from 1960 onwards
- 3Highlighting the widening economic gap
- 4Showing the final data points for both countries
On-screen text
GDP Per Capita (USD)
united_states
china
1960
$3.00 K
1961
$3.19 K
$72.13
1963
$3.45 K
$78.97
1965
$3.82 K
$98.49
1966
$4.26 K
$99.17
1968
$4.82 K
$95.08
1970
$5.27 K
$113.62
1971
$5.93 K
$127.48
1973
$6.93 K
$158.36
1975
$7.80 K
$178.34
1976
$9.24 K
$180.42
1978
$10.93 K
$165.59
1980
$12.69 K
$194.99
1981
$14.32 K
$201.77
1983
$16.20 K
$235.97
1985
$18.31 K
$293.41
1986
$19.80 K
$259.34
1988
$21.90 K
$292.65
1990
$23.93 K
$319.16
1991
$25.06 K
$355.35
1993
$26.93 K
$417.43
1995
$28.80 K
$617.92
1996
$31.09 K
$763.66
1998
$33.55 K
$847.22
2000
$36.40 K
$967.17
2001
$37.78 K
$1.12 K
2003
$40.42 K
$1.38 K
2005
$44.30 K
$1.78 K
2006
$47.47 K
$2.50 K
2008
$48.11 K
$3.59 K
2010
$48.65 K
$4.55 K
2011
$51.35 K
$6.13 K
2013
$54.20 K
$7.28 K
2015
$57.14 K
$8.02 K
2016
$59.62 K
$8.58 K
2018
$64.20 K
$10.00 K
2020
$64.99 K
$10.59 K
2021
$76.36 K
$12.65 K
2023
$83.78 K
$12.90 K
2024
$85.20 K
$13.31 K
Original caption
USA 🇺🇸 vs China 🇨🇳 — Who’s REALLY richer per person? The gap isn’t just big… it’s shocking. You won’t believe how far apart they are. Stick around till the end — the numbers speak LOUD. #USAChina #GDPperCapita #TrendingNow #MindBlown #DataTalks #WorldEconomy #ForYou #ViralVideo #FinanceTok #FYP #SmartTikTok #WatchThis #GlobalWealth #ChartTok #EconomyExplained #ViralChallenge #DidYouKnow#fyp #foryoupage #explore #fypp #viralvideos
More from @economy.wars2
More breakout videos from this creator.