Loading video…
Sound

original sound - bl0ckchain.bulllh0rn
Blockchainbullhorn🐂 · Original audio
0:00–:––
Playing this video’s own audio, so you’ll hear the creator over the sound.
This video promotes it, but we haven’t matched it to a product page yet, so there are no product figures.
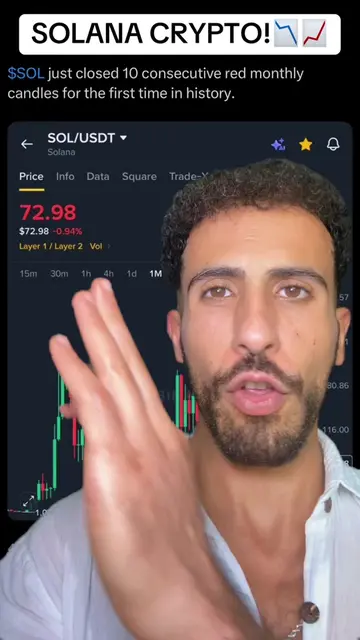
The video effectively uses a visual demonstration of technical analysis on a popular cryptocurrency (Solana) to explain complex concepts like Fibonacci retracements and support/resistance levels. The creator's confident and direct explanation, combined with the clear on-screen graphics, makes the information accessible and engaging, positioning the course as a valuable resource for learning these trading strategies.
The video demonstrates how to use Fibonacci retracement levels to analyze Solana's price chart. The creator explains key support and resistance levels, emphasizing the importance of breaking certain thresholds for bullish or bearish movements. The content is presented as part of a paid course.
Solana updates , How to do cryptos , Cryptocurrency Today, Crypto Market Now , Latest Crypto updates, Lastest crypto trends Crypto Market Trends #cryptonews #Cryptoinvest #Cryptoupdates #tradingtips #Cryptomarket
Watch this.
Introduction and identifying key lines on the chart
Applying Fibonacci retracement tool
Identifying support and resistance levels
Explaining bullish and bearish scenarios
Concluding with the course offering
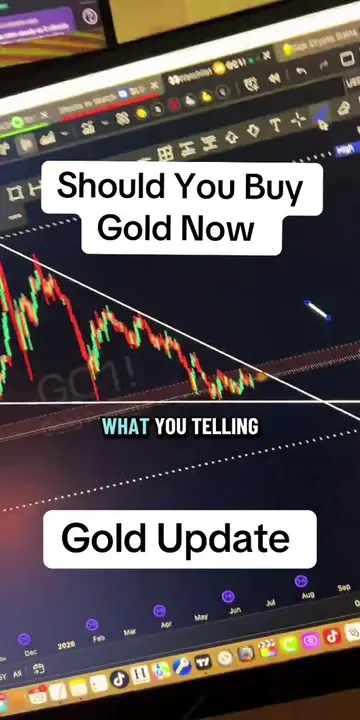
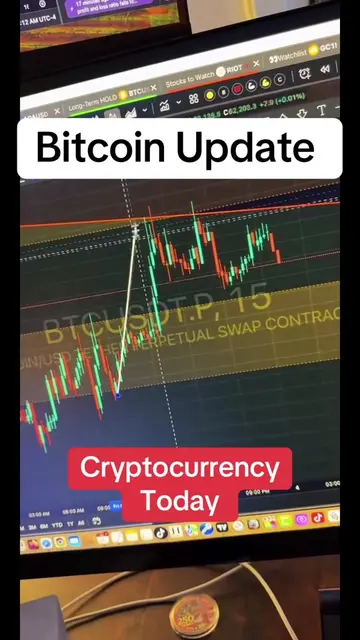
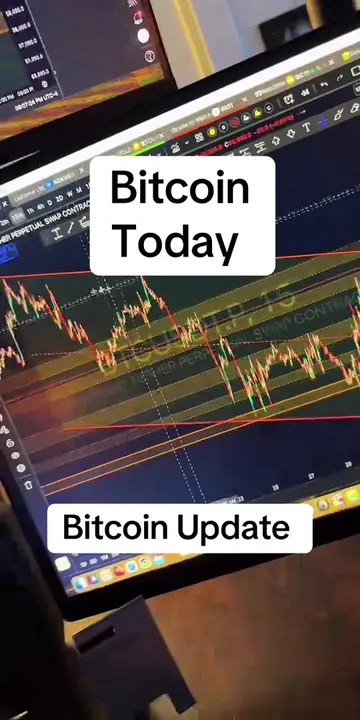
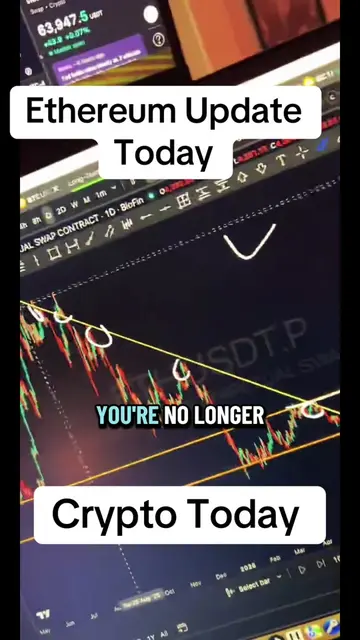
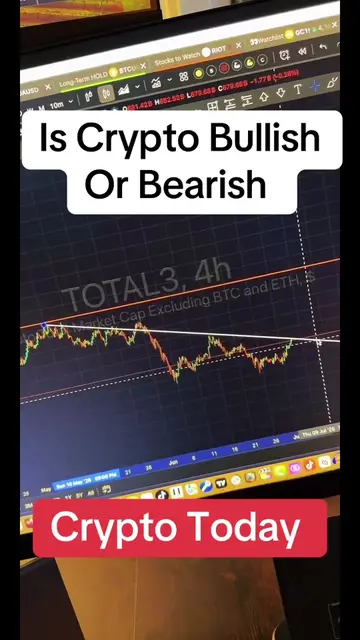
The video uses a screen recording of a trading chart, specifically showing Solana (SOL) price action. Fibonacci retracement levels are drawn and manipulated on the chart to illustrate trading concepts. The creator explicitly mentions that this analysis is part of 'my course'.
Playing this video’s own audio, so you’ll hear the creator over the sound.
Outliers and viral hits: their videos on Overshot, all time.