Loading video…
All breakouts

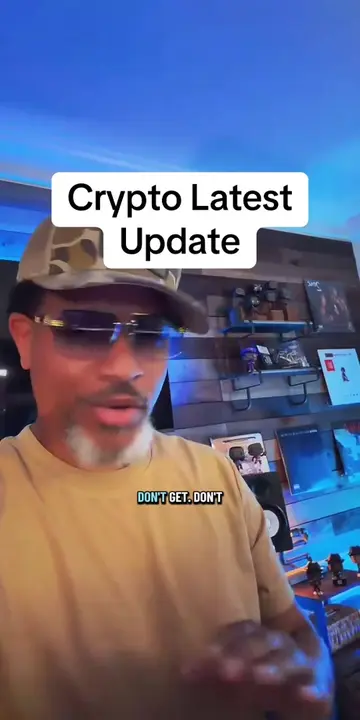
3.3Talking Head
Hook
How to do Cryptos How to use trading Timeframe
@bl0ckchain.bulllh0rn
3.1K followers · usually 913 views a post
Views
3.0K
Likes
113
Comments
4
Shares
12
Why it worked
The video effectively explains a complex trading concept (timeframe analysis) using clear analogies and visual cues, making it easy for beginners to understand and apply.
Summary
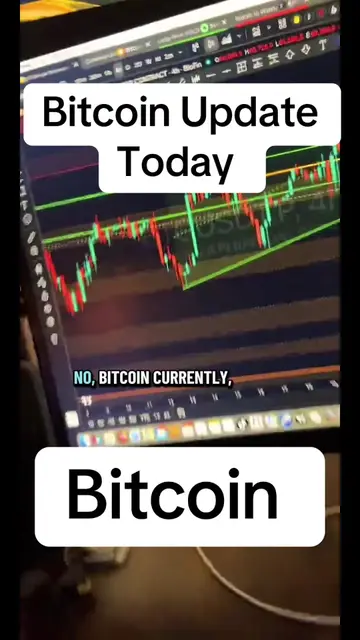
The video explains how to use different trading timeframes to analyze cryptocurrency charts. It demonstrates how switching from a daily chart to a four-hour or one-hour chart provides more granular detail about market momentum and the
Structure
- 1Introduction to crypto trading timeframes
- 2Explaining daily candles
- 3Comparing daily to 4-hour charts
- 4Comparing 4-hour to 1-hour charts
- 5Discussing 15-minute charts for detailed analysis
- 6Concluding on the benefit of zooming in
On-screen text
How to do
Cryptos
How to use trading
Timeframe
Transcript
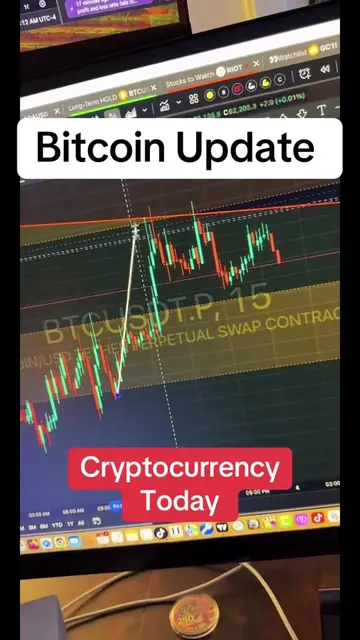
A daily candle can show me a green bar. But if I go to a four hour chart, I'm gonna get six candles, three of them can be up, three of them can be down, and depending on how they move, and see what's day chart. I can pull back out, look at the day chart say this thing is green, go to the and those candles, that's gonna be six of them, right for the day. I can see who's winning the battle, a little bit more detail. winning the battle? Are the bulls winning the battle, are the bears winning the battle of that? If I want detail, to a one hour chart, there will be 24 of those candles. I can literally go in and see in great detail who's winning the battle throughout the day. So you, you is going, right? 15 minute candle. Oh my gosh, there's tons of candles inside of there. I can actually see what's happening throughout the day. Is there more bullish momentum, more bearish momentum? Is it stalling out a little bit? Right, so that means I can look at the macro view of what's happening. Zoom in, zoom in some more. More. Y'all see what I did there? All in your face. I can look at a daily chart. I can zoom in in 4 hour 1 hour 15 minute. I wanna see what's happening.
Original caption
Crypto Education, Crypto Basics , How to do Cryptos #crytoupdate #cryptomarket #tradingtips #cryptonews #cryptobasics
More from @bl0ckchain.bulllh0rn
Their other posts in the index, biggest breakout first.