Loading video…
Sound

original sound - pacemorby
Pace Morby · Original audio
0:00–:––
Playing this video’s own audio, so you’ll hear the creator over the sound.
We didn’t find a product being promoted in this video. Its hook, format and structure below still show why it took off.
Browse products winning on TikTokThe video effectively uses a clear, data-driven visual to highlight a significant economic issue that resonates with a broad audience, particularly younger demographics concerned about housing affordability.
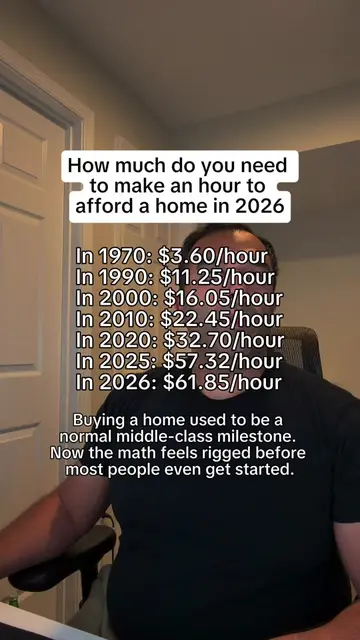
The video displays a chart showing the increasing hourly pay required to afford a house from 1970 to a projected 2026. It highlights the significant gap between wage growth and housing costs, suggesting that simply working harder is not a solution for many younger buyers.
Buying a home didn't just get more expensive. The income needed to qualify grew much faster than hourly wages. According to this comparison, the required wage climbed from $3.60 an hour in 1970 to more than $61 an hour in 2026. That is roughly $128,000 a year before taxes. 😱 This is why “just work harder” is bullsh*t for so many younger buyers. The target moved. Personal responsibility matters. So do home prices, mortgage rates, insurance, property taxes, and wages that have not kept up. If you want the cheat code to buying real estate with no money, no banks, and no credit... Click link in bio to rsvp for a free live training. #investingadvice #realestatetips #homebuyer
Hourly Pay Required to Afford a House
Introduction of the topic: Hourly Pay Required to Afford a House
Presentation of historical data (1970-2020)
Projection of future required pay (2025-2026)
Concluding statement on the affordability crisis
Playing this video’s own audio, so you’ll hear the creator over the sound.
Outliers and viral hits: their videos on Overshot, all time.