Loading video…
All breakouts
89.3Text-HeavyResult / Flex hookEntertainment
Hook
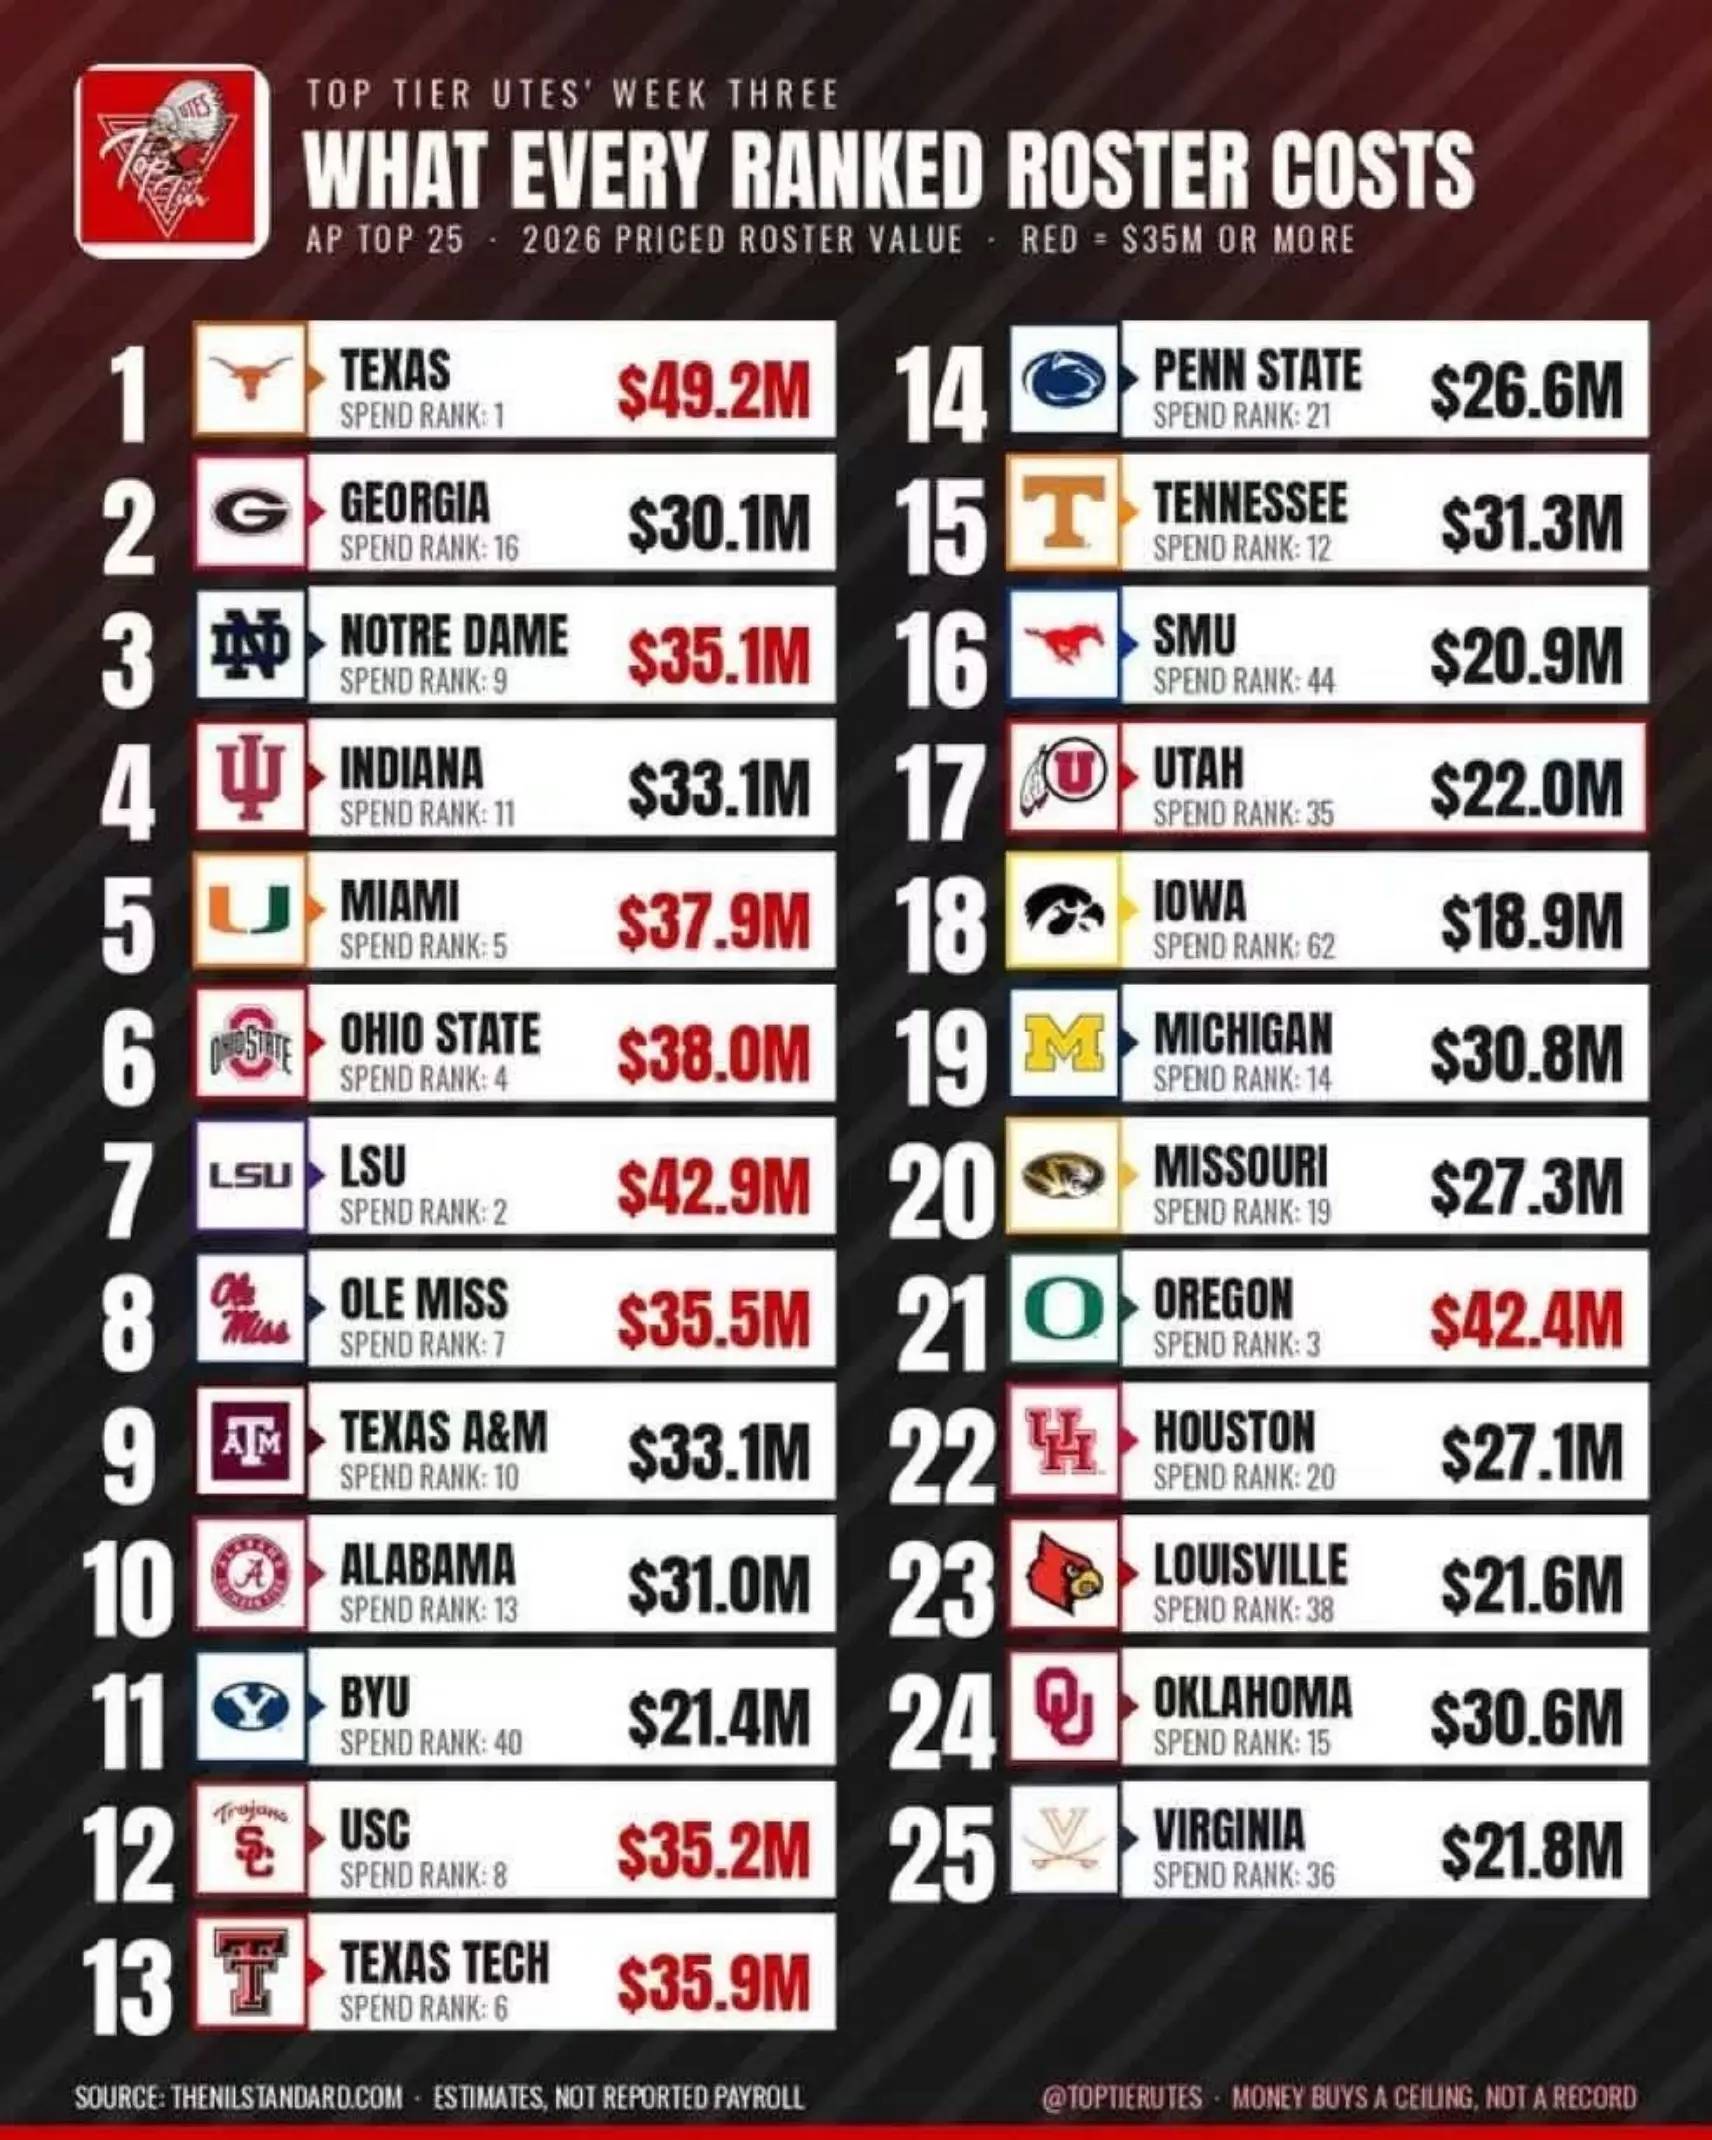
TOP TIER UTES' WEEK THREE WHAT EVERY RANKED ROSTER COSTS
@sotexstuff
8.4K followers · usually 361 views a post
Views
32.0K
Likes
90
Comments
31
Shares
32
Why it worked
The content leverages high-interest sports data and a controversial premise ('money buys a ceiling, not a record') to drive engagement and debate among college football fans.
Summary
This post presents a data visualization ranking the top 25 college football teams by their estimated 2026 roster value. It highlights the correlation between spending and team success.
Structure
- 1Title slide introducing the cost of ranked rosters
- 2List of teams 1-13 with their respective spending and rank
- 3List of teams 14-25 with their respective spending and rank
- 4Footer attribution and concluding commentary on the relationship between money and performance
Product placement
thenilstandard.com (appears as a source citation at the bottom of the slide; removing it would not change the content of the data presented).
On-screen text
TOP TIER UTES' WEEK THREE
WHAT EVERY RANKED ROSTER COSTS
AP TOP 25 - 2026 PRICED ROSTER VALUE - RED = $35M OR MORE
1 TEXAS SPEND RANK: 1 $49.2M
2 GEORGIA SPEND RANK: 16 $30.1M
3 NOTRE DAME SPEND RANK: 9 $35.1M
4 INDIANA SPEND RANK: 11 $33.1M
5 MIAMI SPEND RANK: 5 $37.9M
6 OHIO STATE SPEND RANK: 4 $38.0M
7 LSU SPEND RANK: 2 $42.9M
8 OLE MISS SPEND RANK: 7 $35.5M
9 TEXAS A&M SPEND RANK: 10 $33.1M
10 ALABAMA SPEND RANK: 13 $31.0M
11 BYU SPEND RANK: 40 $21.4M
12 USC SPEND RANK: 8 $35.2M
13 TEXAS TECH SPEND RANK: 6 $35.9M
14 PENN STATE SPEND RANK: 21 $26.6M
15 TENNESSEE SPEND RANK: 12 $31.3M
16 SMU SPEND RANK: 44 $20.9M
17 UTAH SPEND RANK: 35 $22.0M
18 IOWA SPEND RANK: 62 $18.9M
19 MICHIGAN SPEND RANK: 14 $30.8M
20 MISSOURI SPEND RANK: 19 $27.3M
21 OREGON SPEND RANK: 3 $42.4M
22 HOUSTON SPEND RANK: 20 $27.1M
23 LOUISVILLE SPEND RANK: 38 $21.6M
24 OKLAHOMA SPEND RANK: 15 $30.6M
25 VIRGINIA SPEND RANK: 36 $21.8M
SOURCE: THENILSTANDARD.COM - ESTIMATES, NOT REPORTED PAYROLL
@TOPTIERUTES - MONEY BUYS A CEILING, NOT A RECORD
Original caption
#NIL is the new era, but it doesn't always translate to wins, just ask OSU and Oregon 🤷🏾♂️ #CFB #football #texas #oregon
More from @sotexstuff
More breakout videos from this creator.