Loading video…
Sound

original sound - tssearle
tssearle · Original audio
0:00–:––
Playing this video’s own audio, so you’ll hear the creator over the sound.
We didn’t find a product being promoted in this video. Its hook, format and structure below still show why it took off.
Browse products winning on TikTokThe creator uses a high-contrast, physical metaphor (drawing on a luxury car) to explain a complex data concept, making the educational content visually arresting and easy to digest.
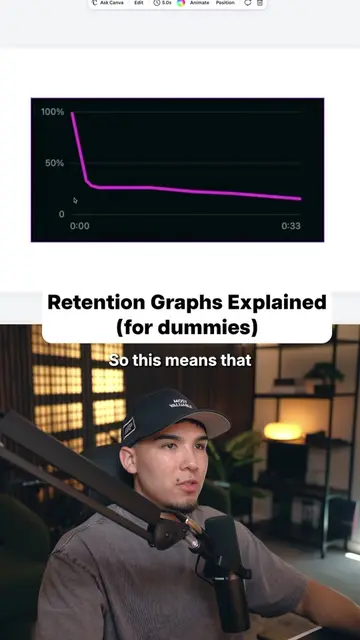
The creator uses a dry-erase marker to draw retention graphs on the side of a car to explain what different graph shapes indicate about video performance. He categorizes the shapes as either bad hooks, bad endings, or successful videos.
What do your retention graphs look like right now? Be honest. #contentcreator #videotips #retention
This means your hook sucked.
Identify bad hook graph
Identify good hook but bad middle graph
Identify bad ending graph
Identify successful video graph
Encourage creator to replicate success
Playing this video’s own audio, so you’ll hear the creator over the sound.
Promotes 1 product. Create free account to see more.
Outliers and viral hits: their videos on Overshot, all time.