Loading video…
All breakouts Locked — upgrade to Pro to open.Open on TikTokPro
No preview available · watch on TikTok below
11.7Finance
Post
Post by @yunggeeski
@yunggeeski
22.6K followers · usually 8.9K views a post
Views
100.6K
Likes
817
Comments
383
Shares
72
We’re still analyzing this post.
Original caption
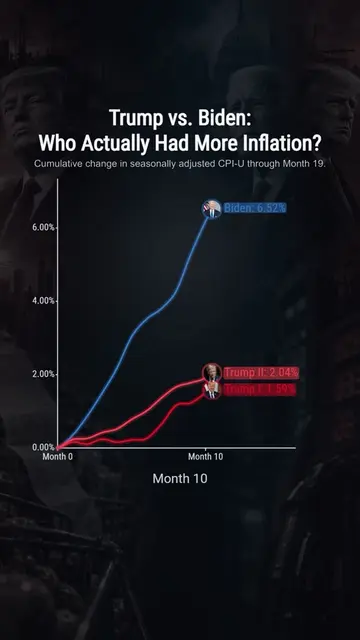
One post I’m apparently MAGA. The next I’m apparently a Biden supporter. Meanwhile I’m just converting gas prices into the same dollars. First 20 months, adjusted to Sep. 2026 dollars: Trump II*: $4.32 Biden: $4.19 Trump I: $3.77 No, this does not mean gas literally displayed those inflation-adjusted prices at the pump during Biden’s term. And no, it does not mean the president personally controls gas prices. EIA’s national gasoline series measures retail pump prices, including taxes, using a weighted sample of U.S. outlets. The chart compares what those prices are worth in the same purchasing-power dollars. You can argue about why the lines moved. Just don’t confuse “prices during a presidency” with “prices caused entirely by that president.” Those are different claims. Political charts continue to be the world’s most efficient machine for turning basic arithmetic into a family argument. *Sep. 2026 gas is partial through Sept. 21; September CPI uses the Cleveland Fed’s current +0.43% MoM nowcast. #GasPrices #Inflation #Trump #Biden #Economy Pinned comment: The chart says higher gas prices, not who caused them. If you added the causal claim yourself, take it up with the person who added it: you.
More from @yunggeeski
More breakout videos from this creator.