Loading video…
All breakouts
25.1Text-HeavyStory Open hookFinance
Hook
2 people invest $10,000 10 years ago
@jacobdoesmoney2
16.8K followers · usually 6.8K views a post
Views
133.3K
Likes
1.3K
Comments
90
Shares
101
Why it worked
The video uses a clear, high-contrast visual comparison to demonstrate the power of sector-specific investing versus broad market indices, tapping into the viewer's desire for high-growth financial information.
Summary
A side-by-side comparison shows the growth of a $10,000 investment in the S&P 500 (VOO) versus a semiconductor ETF (SMH) over a 10-year period. The video highlights the significant performance difference between the two investment vehicles by 2026.
Structure
- 1Initial investment setup
- 2Year-by-year growth comparison
- 3Final 2026 valuation reveal
On-screen text
2 people invest $10,000 10 years ago
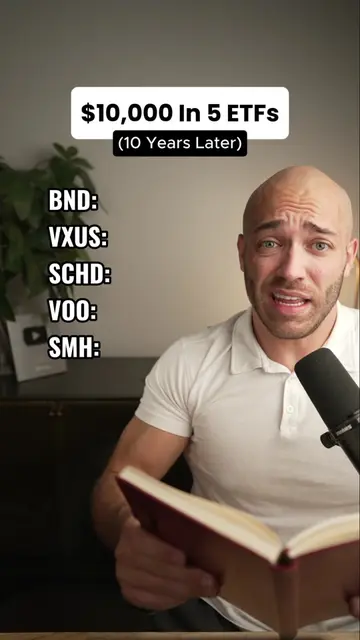
VOO S&P 500
SMH Semiconductor ETF
2017: $13,659
2018: $13,044
2019: $17,134
2020: $20,267
2021: $26,100
2022: $21,353
2023: $26,973
2024: $33,711
2025: $39,718
2026: $43,678
2017: $18,763
2018: $17,067
2019: $28,064
2020: $43,651
2021: $62,046
2022: $41,248
2023: $71,512
2024: $99,459
2025: $148,363
2026: $270,213
Original caption
2 people invest $10,000 approximately 10 years ago... One invests in VOO(The S&P 500) and the other invests in SMH(A Semiconductor ETF). Who has more in 2026?
More from @jacobdoesmoney2
More breakout videos from this creator.