Loading video…
Sound

original sound - how.to.power.bi
Bas | How To Power BI · Original audio
0:00–:––
Playing this video’s own audio, so you’ll hear the creator over the sound.
The video provides a practical, step-by-step tutorial on a specific Power BI feature, appealing to users looking to enhance their data visualization skills. The use of native features makes it accessible and directly applicable without requiring external tools.
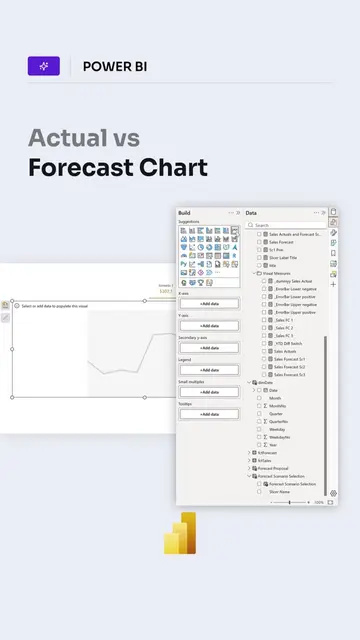
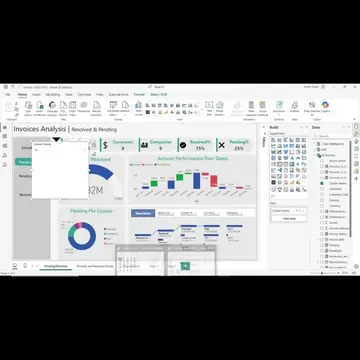
This video demonstrates how to create a bubble chart in Power BI using only native features. It covers setting up bubble positioning, layering labels, and formatting callouts with conditional colors for growth and decline.
Floating ‘bubble’ callouts using only native Power BI features in less than 1 minute. In this short video, I will show you: ✅ How to build a hidden measure for bubble positioning ✅ How to layer a label element on top of your bars ✅ How to format the callout labels with conditional colors (green for growth, red for decline) ✅ How to make it look polished enough for an executive dashboard Hope you enjoy building it, even if just for fun ;) See a full video this technique is based on (link in comments) Save this for your next report Follow for Power BI + Fabric + AI
POWER BI DESIGN TRANSFORMATION
Search for bubble chart visualization
Add Sales Segment to X-axis
Add Total Sales to Y-axis
Add Bubble Pos to Bubble Size
Format Bubble Pos for size scaling
Apply conditional formatting to colors
Power BI: This is a business intelligence tool that is used to create visualizations and reports. It is operated throughout the video. Removing it would change what happens in the video.
Playing this video’s own audio, so you’ll hear the creator over the sound.
Promotes 3 products. Create free account to see more.
Outliers and viral hits: their videos on Overshot, all time.
Business intelligence software for creating data visualizations and reports
All time.