Loading video…
All breakouts
5.6App DemoListicle hookEducation
Hook
الحلقه الثالثه من سلسله ما تستخدمش الاكسل في عمل الداشبورد
@worksmart_nohasheta
7.8K followers · usually 709 views a post
Views
3.9K
Likes
154
Comments
3
Shares
22
Why it worked
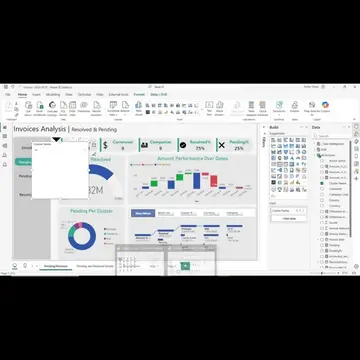
The video effectively showcases the advanced AI capabilities of Power BI for data analysis and insight generation, positioning it as a superior alternative to Excel for dashboard creation. It uses clear demonstrations and explains the benefits of these features in a practical context.
Summary
The video demonstrates two AI-powered visualization tools in Power BI: Decomposition Tree and Key Influencers. It explains how these tools help in quickly extracting insights from data, unlike Excel, by analyzing relationships and identifying key factors affecting sales.
Structure
- 1Introduction to AI visuals in Power BI vs. Excel
- 2Demonstration of Decomposition Tree for detailed data analysis
- 3Explanation of Key Influencers for identifying sales drivers
Original caption
الحلقة الثالثة: ما تستخدمش الاكسيل في عمل داش بورد #dashboard #excel #powerbi #don'tuseexcelfordashboard
More from @worksmart_nohasheta
More breakout videos from this creator.