Loading video…
All breakouts
15.1App DemoHow-To hookEducation
Hook
If you're trying to learn Power BI and you're a complete beginner, I always recommend doing Microsoft's free self-learn Dashboard in a Day training.
@jennytumay
2.1K followers · usually 1.9K views a post
Views
24.2K
Likes
1.2K
Comments
19
Shares
187
Promoted product
Microsoft Power BI Dashboard in a Day
Why it worked
It provides high-value, actionable advice for a specific professional skill set, solving a common 'how to start' problem for beginners.
Summary
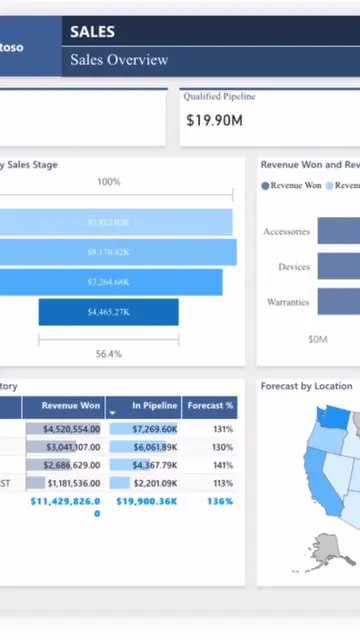
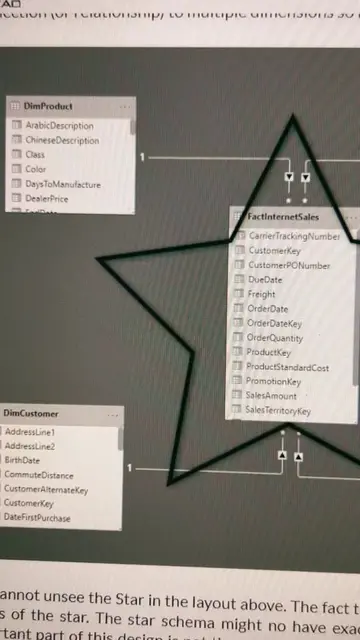
The creator recommends a free Microsoft training course for beginners learning Power BI. She demonstrates how to navigate the website and download the training materials.
Structure
- 1State recommendation for Power BI beginners
- 2Show search results for the training
- 3Demonstrate website navigation
- 4Show downloaded files and PDF content
- 5Encouraging closing statement
Product placement
The video is a direct tutorial on how to access and use the Microsoft 'Dashboard in a Day' training program.
Original caption
People always ask me about how I learned #powerbi, well, this was how it all started! #dataanalysis #microsoft #dataanalyst
More from @jennytumay
More breakout videos from this creator.