Loading video…
Sound

original sound - netmanetwork
Netma · Original audio
0:00–:––
Playing this video’s own audio, so you’ll hear the creator over the sound.
Hook
Posted Jun 7, 2026Video · 1:03by @netmanetwork
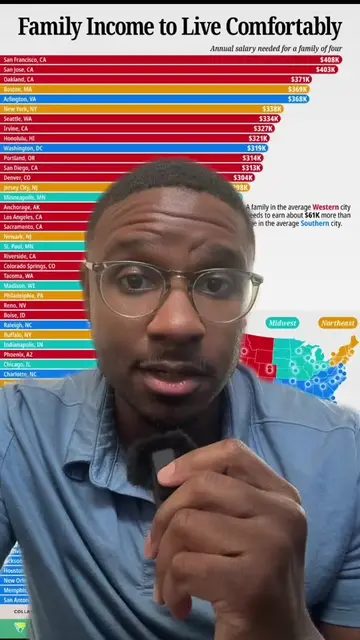
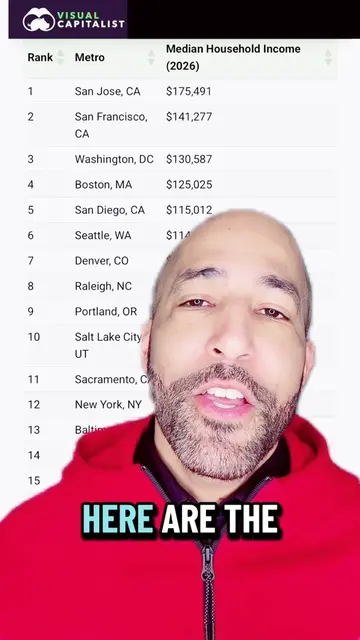
The video uses a high-value, relatable data visualization to anchor a discussion on a topic (cost of living) that is currently a major pain point for the audience.
The creator discusses the affordability of living in the Midwest compared to coastal cities using a data visualization map. He encourages viewers to consider moving to or staying in the Midwest based on these cost-of-living insights.
The Midwest is the most affordable place to live in America. #usa #midwest #affordable #greenscreen
People sleep on the Midwest all the time and they overlook just how affordable it is to live in middle America.
Introduction to the affordability of the Midwest
Comparison of Midwest vs. coastal city living costs
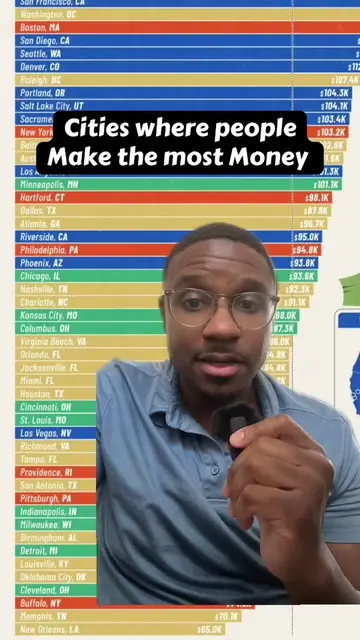
Highlighting specific affordable cities in the Midwest and Texas
Discussion on housing costs and the potential for the Midwest
Call to action for viewer engagement
The Voronoi app logo and branding are visible on the data visualization map throughout the video.
Let me know what you think and if you like these sorts of discussions, like and follow for more.
Playing this video’s own audio, so you’ll hear the creator over the sound.
Data visualization platform that turns datasets into maps and charts
All time.
Promotes 2 products. Create free account to see more.
Outliers and viral hits: their videos on Overshot, all time.