Loading video…
Sound

original sound - codingai
Eric · Original audio
0:00–:––
Playing this video’s own audio, so you’ll hear the creator over the sound.
This video promotes it, but we haven’t matched it to a product page yet, so there are no product figures.
The video uses a highly relatable and controversial topic—school quality—combined with unique, self-generated data visualizations that provide immediate, visual proof of the creator's expertise.
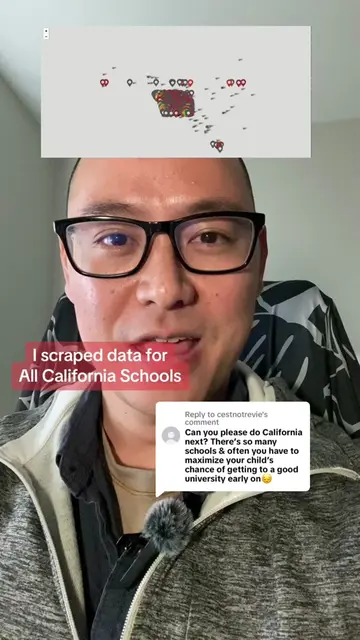
The creator analyzes elementary school performance data across US states by scraping and mapping school report cards. He highlights the disparity in educational standards between states and directs viewers to his project links for further exploration.
Replying to @Vee see the maps in my links. Virginia’s elementary schools are outstanding #datascraping #computerscienceproject #dataanalytics #codingai
5 worst states In the US
Introduction to the data scraping project
Visual comparison of school performance between Virginia and West Virginia
Explanation of the creator's motivation for the project
Comparison of kindergarten standards between Iowa and West Virginia
Summary of the best and worst performing states
Call to action to visit the project links
The creator's data scraping project and the associated maps are the central subject of the video, with the link provided in the bio.
see the maps in my links
Playing this video’s own audio, so you’ll hear the creator over the sound.
Promotes 6 products. Create free account to see more.
Outliers and viral hits: their videos on Overshot, all time.