Loading video…
Sound

original sound - distilledscience
Avisha |🧬Scientist Mythbuster · Original audio
0:00–:––
Playing this video’s own audio, so you’ll hear the creator over the sound.
We didn’t find a product being promoted in this video. Its hook, format and structure below still show why it took off.
Browse products winning on TikTokThe video addresses a highly debated and polarizing topic (AI's environmental impact) with a structured, fact-based approach, using clear visuals and citations to build credibility. By debunking common myths and providing nuanced information, it appeals to a broad audience interested in AI and environmental sustainability.
The video debunks common misconceptions about AI's water footprint by presenting 10 nuanced facts with citations. It clarifies the difference between water withdrawal and consumption, explains various types of water footprints (green, blue, gray), and highlights the significant water usage of data centers, including both direct consumption and indirect use for power generation. The video also discusses future projections and potential solutions like closed-loop cooling systems.
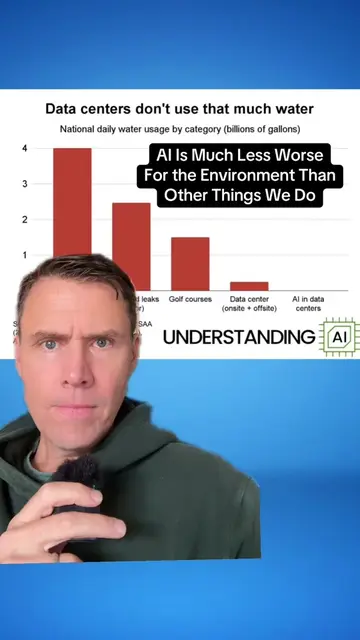
AI Water use is weirdly polarizing: The people who hate AI like to talk about how it's destroying the environment, often quoting the one bottle per prompt statistic, and the AI supporters tend to write the whole thing off as nothing compared to real water sucks, like beef or corn. Or golf. But, as per usual, the issue NEEDS NUANCE! A normal text prompt can have a tiny direct cooling footprint while billions of requests, expanding infrastructure and electricity generation create a much larger aggregate footprint. National totals can also look small while one facility creates serious pressure on a particular town, aquifer or water system. The numbers change depending on whether we count withdrawal or consumption; direct cooling or electricity; blue water or rain; averages or peaks; measurements or projections. It’s what lets each side with apparently contradictory claims each sound credible. Pay attention: Google's use of median vs. mean is tricky. Two precision notes for this video: The 0.04% national comparison is derived by dividing LBNL’s modeled 2023 data-center consumption by an older national blue-water-footprint estimate Microsoft’s paper says 31–52% less blue water in its abstract, while its main results table reports 31–48% under grid electricity. The table is the safer figure. Morgan Stanley’s 1.068-trillion-liter number is a 2028 base-case projection for global AI-data-center cooling and electricity—not a measurement, withdrawal estimate or all-data-center total. The point isn’t that AI is harmless or uniquely catastrophic. It’s that we need comparable, facility-level disclosure with honest boundaries. Peer-reviewed sources and DOIs: Li et al.: DOI 10.1145/3724499 Mekonnen & Hoekstra: DOI 10.5194/hess-15-1577-2011 Rushforth & Ruddell: DOI 10.5194/hess-22-3007-2018 Lei et al.: DOI 10.1016/j.resconrec.2025.108310 Alissa et al.: DOI 10.1038/s41586-025-08832-3 Additional sources: LBNL-2001637; arXiv:2607.02531; Google’s 2025 Gemini environmental analysis; DOE FEMP; USDA EIB-99; Morgan Stanley projection reported by *The Economic Times*.
10 AI Water Facts
Introduction to AI water use nuance
Distinguishing water withdrawal vs. consumption
Defining green, blue, and gray water
Data center water consumption statistics
AI prompt water usage estimates
Projected growth in AI data center water use
The role of hydropower and accounting methods
Comparison to agriculture's water footprint
Benefits of closed-loop cooling systems
Conclusion: Nuance is key
Playing this video’s own audio, so you’ll hear the creator over the sound.
Promotes 1 product. Create free account to see more.
Outliers and viral hits: their videos on Overshot, all time.